
1、Istio简介
要想搞清楚Istio是什么,还需要先知道Service Mesh是什么。
1.1 什么是Service Mesh
中文名:服务网格,是一种用于管理和协调服务之间通信的基础设施层。在现代的分布式应用程序中,由于服务的数量庞大且相互之间的依赖关系复杂,管理服务之间的通信和网络流量成为一项具有挑战性的任务。服务网格通过在应用程序的网络层引入一个透明的代理层来解决这个问题。
服务网格通常由一组专门设计的代理组成,这些代理与应用程序中的每个服务实例一起部署,并负责处理诸如服务发现、负载均衡、安全认证、故障恢复等通信方面的功能。通过将这些功能从应用程序代码中分离出来,服务网格提供了一种集中式的方式来管理和控制服务之间的通信。
服务网格还提供了一些附加功能,例如流量控制、可观察性和监控、故障注入和熔断等。这些功能可以帮助开发人员和运维团队更好地理解和管理分布式应用程序的行为,并提供了一些强大的工具来应对故障和问题。
常见的服务网格实现包括Istio、Linkerd和Consul等。这些实现通常基于开放的标准和协议,如Envoy代理和Service Mesh Interface(SMI)规范,以确保它们的兼容性和互操作性。
总之,服务网格是一种为复杂的分布式应用程序提供通信管理和控制的基础设施层,它通过引入专门设计的代理来简化和增强服务之间的通信,同时提供了一些附加功能来提高应用程序的可观察性和可靠性。
1.2 什么是Istio
参考官网: https://istio.io/latest/zh/about/service-mesh/
官网一句话介绍:Simplify observability, traffic management, security, and policy with the leading service mesh.
翻译过来,就是:通过领先的服务网格简化可观测性,流量管理,安全及策略。
Istio 是一个开源服务网格,它透明地分层到现有的分布式应用程序上。 Istio 强大的特性提供了一种统一和更有效的方式来保护、连接和监视服务。 Istio 是实现负载平衡、服务到服务身份验证和监视的路径——只需要很少或不需要更改服务代码。它强大的控制平面带来了重要的特点,包括:
- 使用 TLS 加密、强身份认证和授权的集群内服务到服务的安全通信
- 自动负载均衡的 HTTP, gRPC, WebSocket,和 TCP 流量
- 通过丰富的路由规则、重试、故障转移和故障注入对流量行为进行细粒度控制
- 一个可插入的策略层和配置 API,支持访问控制、速率限制和配额
- 对集群内的所有流量(包括集群入口和出口)进行自动度量、日志和跟踪
Istio 是为可扩展性而设计的,可以处理不同范围的部署需求。Istio 的控制平面运行在 Kubernetes 上,您可以将部署在该集群中的应用程序添加到您的网格中,将网格扩展到其他集群,甚至连接 VM 或运行在 Kubernetes 之外的其他端点。
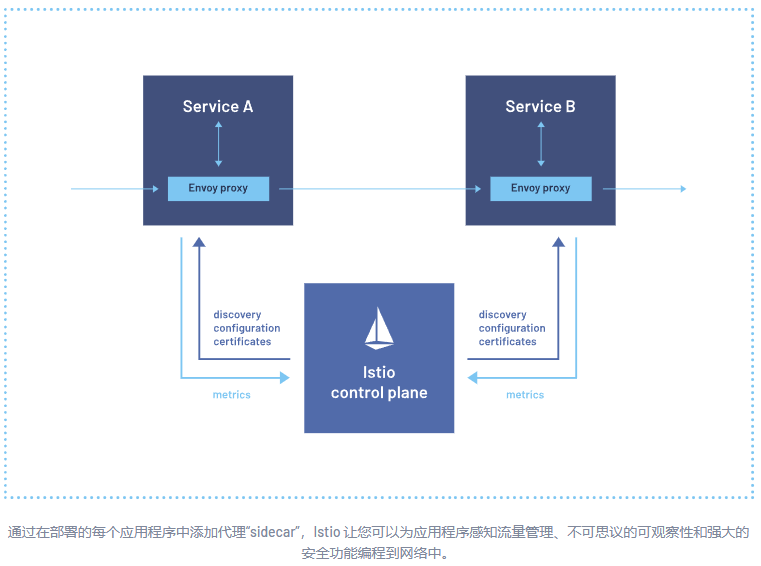
Istio 由两个部分组成:控制平面和数据平面。
- 数据平面是业务之间的通信平面。如果没有一个服务网格,网络就无法理解正在发送的流量,也无法根据它是哪种类型的流量,或者它从谁那里来,到谁那里去做出任何决定。服务网格使用代理拦截所有的网络流量,允许根据您设置的配置提供广泛的应用程序感知功能。代理与您在集群中启动的每个服务一起部署,或者与运行在虚拟机上的服务一起运行。
- 控制平面获取您所需的配置和服务视图,并动态地对代理服务器进行编程,随着规则或环境的变化更新它们。
1.3 Istio相关概念
1)流量管理
Istio 的流量路由规则可以让您轻松地控制服务之间的流量和 API 调用。 Istio 简化了服务级别属性(如断路器、超时和重试)的配置,并使设置重要任务(如 A/B 测试、canary 部署和基于百分比的流量分割的分阶段部署)变得容易。 它还提供了开箱即用的故障恢复特性,帮助您的应用程序更健壮地应对依赖服务或网络的故障。
2)可观测性
Istio 为服务网格内的所有通信生成详细的遥测数据。这种遥测技术提供了服务行为的可观测性,使运营商能够排除故障、维护和优化其应用。 更好的是,它不会给服务开发人员带来任何额外的负担。通过 Istio,操作人员可以全面了解被监视的服务如何与其他服务以及 Istio 组件本身交互。
Istio 的遥测技术包括详细的指标、分布式跟踪和完整的访问日志。有了 Istio,您就可以得到全面全面的服务网格可观察性。
3)安全性能
微服务有特殊的安全需求,包括防止中间人攻击、灵活的访问控制、审计工具和相互的 TLS。 Istio 包括一个全面的安全解决方案,使运营商能够解决所有这些问题。 它提供了强大的身份、强大的策略、透明的 TLS 加密,以及验证、授权和审计(AAA)工具来保护您的服务和数据。
Istio 的安全模型是基于默认安全的,旨在提供深度防御,允许您部署安全的应用程序,甚至跨不可信的网络。
1.4 Istio架构
1)Istio逻辑划分
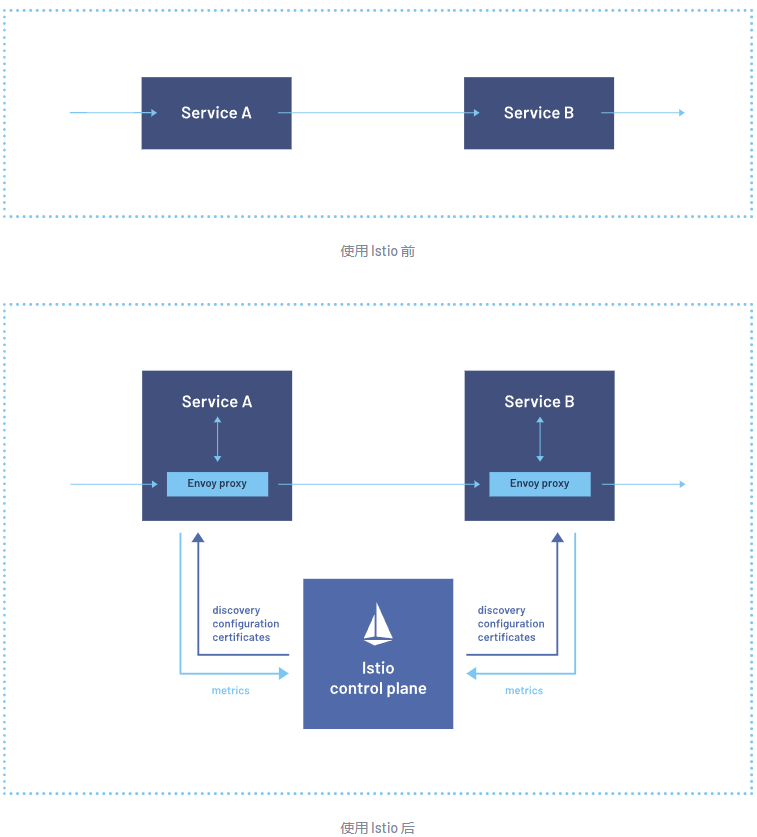
Istio 服务网格从逻辑上分为数据平面和控制平面。
- 数据平面 由一组智能代理(Envoy)组成, 被部署为 Sidecar。这些代理负责协调和控制微服务之间的所有网络通信。 它们还收集和报告所有网格流量的遥测数据。
- 控制平面 管理并配置代理来进行流量路由。
下图展示了组成每个平面的不同组件:

2)核心组件
Envoy(数据面)
Istio 使用 Envoy 代理的扩展版本。Envoy 是用 C++ 开发的高性能代理,用于协调服务网格中所有服务的入站和出站流量。Envoy 代理是唯一与数据平面流量交互的 Istio 组件。
Envoy 代理被部署为服务的 Sidecar,在逻辑上为服务增加了 Envoy 的许多内置特性,例如:
- 动态服务发现
- 负载均衡
- TLS 终端
- HTTP/2 与 gRPC 代理
- 熔断器
- 健康检查
- 基于百分比流量分割的分阶段发布
- 故障注入
- 丰富的指标
这种 Sidecar 部署允许 Istio 可以执行策略决策,并提取丰富的遥测数据, 接着将这些数据发送到监视系统以提供有关整个网格行为的信息。
Sidecar 代理模型还允许您向现有的部署添加 Istio 功能,而不需要重新设计架构或重写代码。
由 Envoy 代理启用的一些 Istio 的功能和任务包括:
- 流量控制功能:通过丰富的 HTTP、gRPC、WebSocket 和 TCP 流量路由规则来执行细粒度的流量控制。
- 网络弹性特性:重试设置、故障转移、熔断器和故障注入。
- 安全性和身份认证特性:执行安全性策略,并强制实行通过配置 API 定义的访问控制和速率限制。
- 基于 WebAssembly 的可插拔扩展模型,允许通过自定义策略执行和生成网格流量的遥测。
Istiod(控制面)
Istiod 提供服务发现、配置和证书管理。
Istiod 将控制流量行为的高级路由规则转换为 Envoy 特定的配置, 并在运行时将其传播给 Sidecar。Pilot 提取了特定平台的服务发现机制, 并将其综合为一种标准格式,任何符合 Envoy API 的 Sidecar 都可以使用。
Istio 可以支持发现多种环境,如 Kubernetes 或 VM。
您可以使用 Istio 流量管理 API 让 Istiod 重新构造 Envoy 的配置,以便对服务网格中的流量进行更精细的控制。
Istiod 安全通过内置的身份和凭证管理, 实现了强大的服务对服务和终端用户认证。您可以使用 Istio 来升级服务网格中未加密的流量。 使用 Istio,运营商可以基于服务身份而不是相对不稳定的第 3 层或第 4 层网络标识符来执行策略。 此外,您可以使用 Istio 的授权功能控制谁可以访问您的服务。
Istiod 充当证书授权(CA),并生成证书以允许在数据平面中进行安全的 mTLS 通信。
说明:在1.15版本之前,控制面并没有istiod这个组件,而是有几个核心组件:Pilot、Galley、Citadel、Mixer等,这几个组件采用微服务模式,组件之间有界限隔离,复杂度很高,配置难度大。1.16版本Istiod官方将控制面直接合成了一个组件istiod,其实功能上还是之前组件的功能。
合并后,优势:
- 简化安装复杂度
- 简化配置复杂度
- 简化控制面维护
- 问题定位更加容易
- 提高了效率及相应能力
再来看看这几个核心组件都负责什么呢?
Pilot
Pilot 是Istio实现流量管理的核心组件,它主要的作用是配置和管理Envoy代理。比如可以为代理之间设置特定的流量规则,或者配置超时、重试、熔断这样的弹性能力。Pilot会将控制流量行为的路由规则转换为Envoy的配置,并在运行时将它们广播到Envoy。另外,Pilot还能够把服务发现机制抽象出来并转换成API分发给Envoy,使得后者具有服务发现的能力。
简单来说,Pilot的主要任务有两个:
- 从平台(如Kubernetes)获取服务信息,完成服务发现。
- 获取Istio的各项配置,转换成Envoy代理可读的格式并分发。
Citadel
Citadel 用于提供服务间的安全通信和身份验证。
Citadel 是 Istio 的一部分,用于管理和颁发服务之间的安全凭证,以确保安全的服务通信。它的主要功能包括:
- 证书管理:Citadel 负责生成和管理服务之间的 Transport Layer Security (TLS) 证书。它可以自动为每个服务生成证书,这些证书用于进行服务之间的安全通信。
- 身份验证:Citadel 实施了服务间的身份验证机制,确保只有经过身份验证的服务能够相互通信。它使用证书对服务进行身份验证,并确保只有具有有效证书的服务才能接收和发送数据。
- 安全凭证分发:Citadel 为服务提供安全凭证,包括身份验证所需的证书和密钥。这些凭证可以被其他组件使用,例如 Envoy 代理,以确保安全的服务通信。
- 证书轮换:Citadel 可以自动管理证书的轮换和更新。它能够在证书过期之前为服务自动颁发新的证书,确保服务的持续安全通信。
Galley
Galley负责管理和配置整个 Istio 系统。
Galley 的主要作用包括以下几个方面:
- 配置管理:Galley 负责收集、验证和分发配置信息给 Istio 系统中的其他组件。它从配置源(例如 Kubernetes ConfigMap 或文件系统)中获取配置,并确保配置的有效性和一致性。
- 配置校验和转换:Galley 对配置进行校验,确保配置满足 Istio 的要求和规范。它会检查配置的语法、格式和合法性,并在必要时进行转换,以便其他组件能够正确理解和使用配置。
- 配置分发:Galley 将经过校验和转换的配置信息分发给 Istio 系统中的其他组件,例如 Pilot和 Citadel。这样,每个组件就能够获得其需要的配置信息,并根据配置来完成相应的任务。
- 事件处理:Galley 监听并处理与配置相关的事件,例如配置的变更或更新。它会及时响应事件,并确保相关组件能够获取最新的配置信息。
- 一致性保证:Galley 通过验证和分发配置,确保整个 Istio 系统中的各个组件都使用相同、一致的配置。这有助于避免配置不一致性带来的问题,并提供了系统级别的配置管理和控制。
2、Istio安装
2.1 使用istioctl部署Istio
1)下载istioctl(在master01上即可)
说明:我这里下载的是1.18.0
$ curl -L https://istio.io/downloadIstio | ISTIO_VERSION=1.18.0 TARGET_ARCH=x86_64 sh -2)配置软链接
$ mv istio-1.18.0/ /opt/istio; ln -s /opt/istio/bin/istioctl /usr/bin/测试
$ istioctl version3)安装istio
$ istioctl install --set profile=demo -y

✔ Istio core installed
✔ Istiod installed
✔ Egress gateways installed
✔ Ingress gateways installed
✔ Installation complete
Making this installation the default for injection and validation.
查看pod
$ kubectl get po -n istio-system

NAME                                    READY   STATUS    RESTARTS   AGE
istio-egressgateway-69cbcfc4d-4m547     1/1     Running   0          2m27s
istio-ingressgateway-58857677f6-q7qgv   1/1     Running   0          2m27s
istiod-94c7678f6-d6k8v                  1/1     Running   0          3m27s
2.2 部署样例应用bookinfo
1)关于Bookinfo
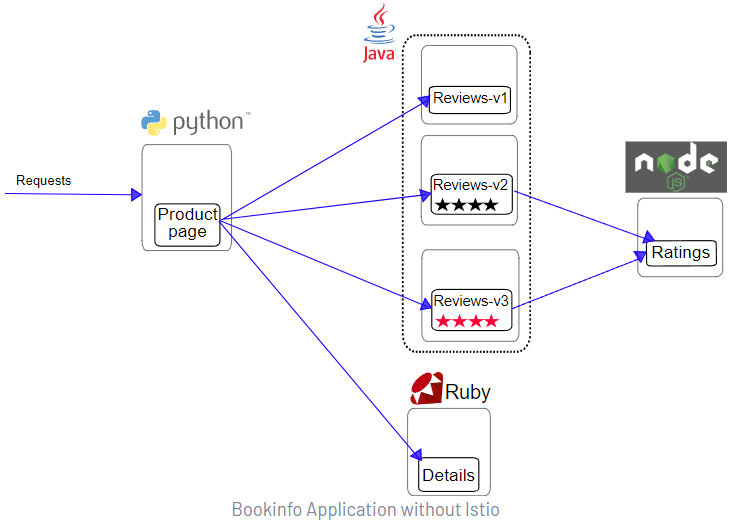
这是一个官方提供的用来演示Istio特性的示例应用,该应用由四个单独的微服务组成:
- Productpage:这个微服务会调用 Details 和 Reviews 两个微服务,用来生成页面。
- Details:这个微服务中包含了书籍的信息。
- Reviews:这个微服务中包含了书籍相关的评论。它还会调用 Ratings 微服务。
- Ratings:这个微服务中包含了由书籍评价组成的评级信息。
Reviews 微服务有 3 个版本:
- v1 版本不会调用 Ratings 服务。
- v2 版本会调用 Ratings 服务,并使用 1 到 5 个黑色星形图标来显示评分信息。
- v3 版本会调用 Ratings 服务,并使用 1 到 5 个红色星形图标来显示评分信息。
2)部署示例应用
给default命名空间打标签,目的是让该命名空间下的应用可以让Istio注入
$ kubectl label namespace default istio-injection=enabled部署Bookinfo
$ cd /opt/istio/
$ kubectl apply -f samples/bookinfo/platform/kube/bookinfo.yaml
如果pod状态为Init:CrashLoopBackOff,需要手动加载一下iptables模块,CentOS7系统没有该问题
先手动加载(三台机器都做)
$ modprobe ip_tables
$ modprobe iptable_filter
检测
$ lsmod |grep -E "ip_tables|iptable_filter"

iptable_filter         16384  0
ip_tables              28672  1 iptable_filter
为了让机器重启后自动加载模块,可以修改配置文件
$ cat > /etc/sysconfig/modules/iptables.modules <<EOF
modprobe -- ip_tables
modprobe -- iptable_filter
EOF

$ chmod 755 /etc/sysconfig/modules/iptables.modules
查看pod状态
$ kubectl get po

NAME                                         READY   STATUS      RESTARTS   AGE
details-v1-7c7dbcb4b5-56jkm                  2/2     Running     0          9m45s
productpage-v1-664d44d68d-tmg67              2/2     Running     0          9m45s
ratings-v1-844796bf85-89cbk                  2/2     Running     0          9m45s
reviews-v1-5cf854487-2nttg                   2/2     Running     0          9m45s
reviews-v2-955b74755-pqs6r                   2/2     Running     0          9m45s
reviews-v3-797fc48bc9-sq89j                  2/2     Running     0          9m45s
查看svc状态
$ kubectl get svc

NAME                           TYPE        CLUSTER-IP      EXTERNAL-IP   PORT(S)               AGE
details                        ClusterIP   10.15.133.71    <none>        9080/TCP              10m
kubernetes                     ClusterIP   10.15.0.1       <none>        443/TCP               2d
productpage                    ClusterIP   10.15.243.175   <none>        9080/TCP              10m
ratings                        ClusterIP   10.15.149.213   <none>        9080/TCP              10m
reviews                        ClusterIP   10.15.60.123    <none>        9080/TCP              10m
设置对外访问
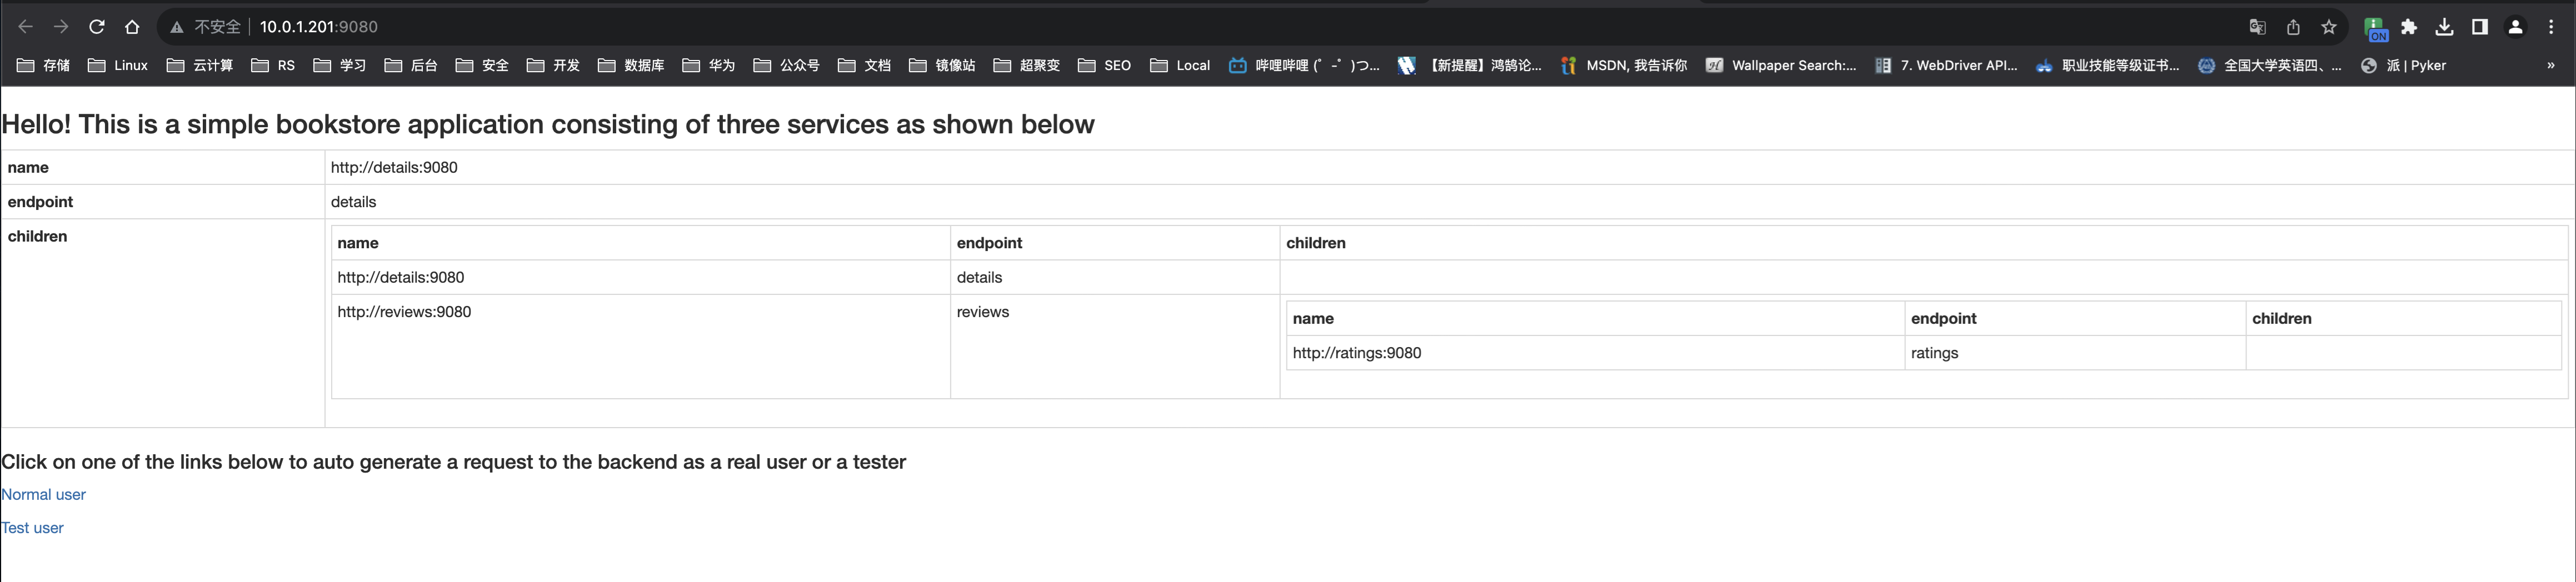
$ nohup kubectl port-forward svc/productpage --address 10.0.1.201 9080:9080 &浏览器访问:
http://10.0.1.201:9080
3、Istio部署样例应用程序Weather Forecast
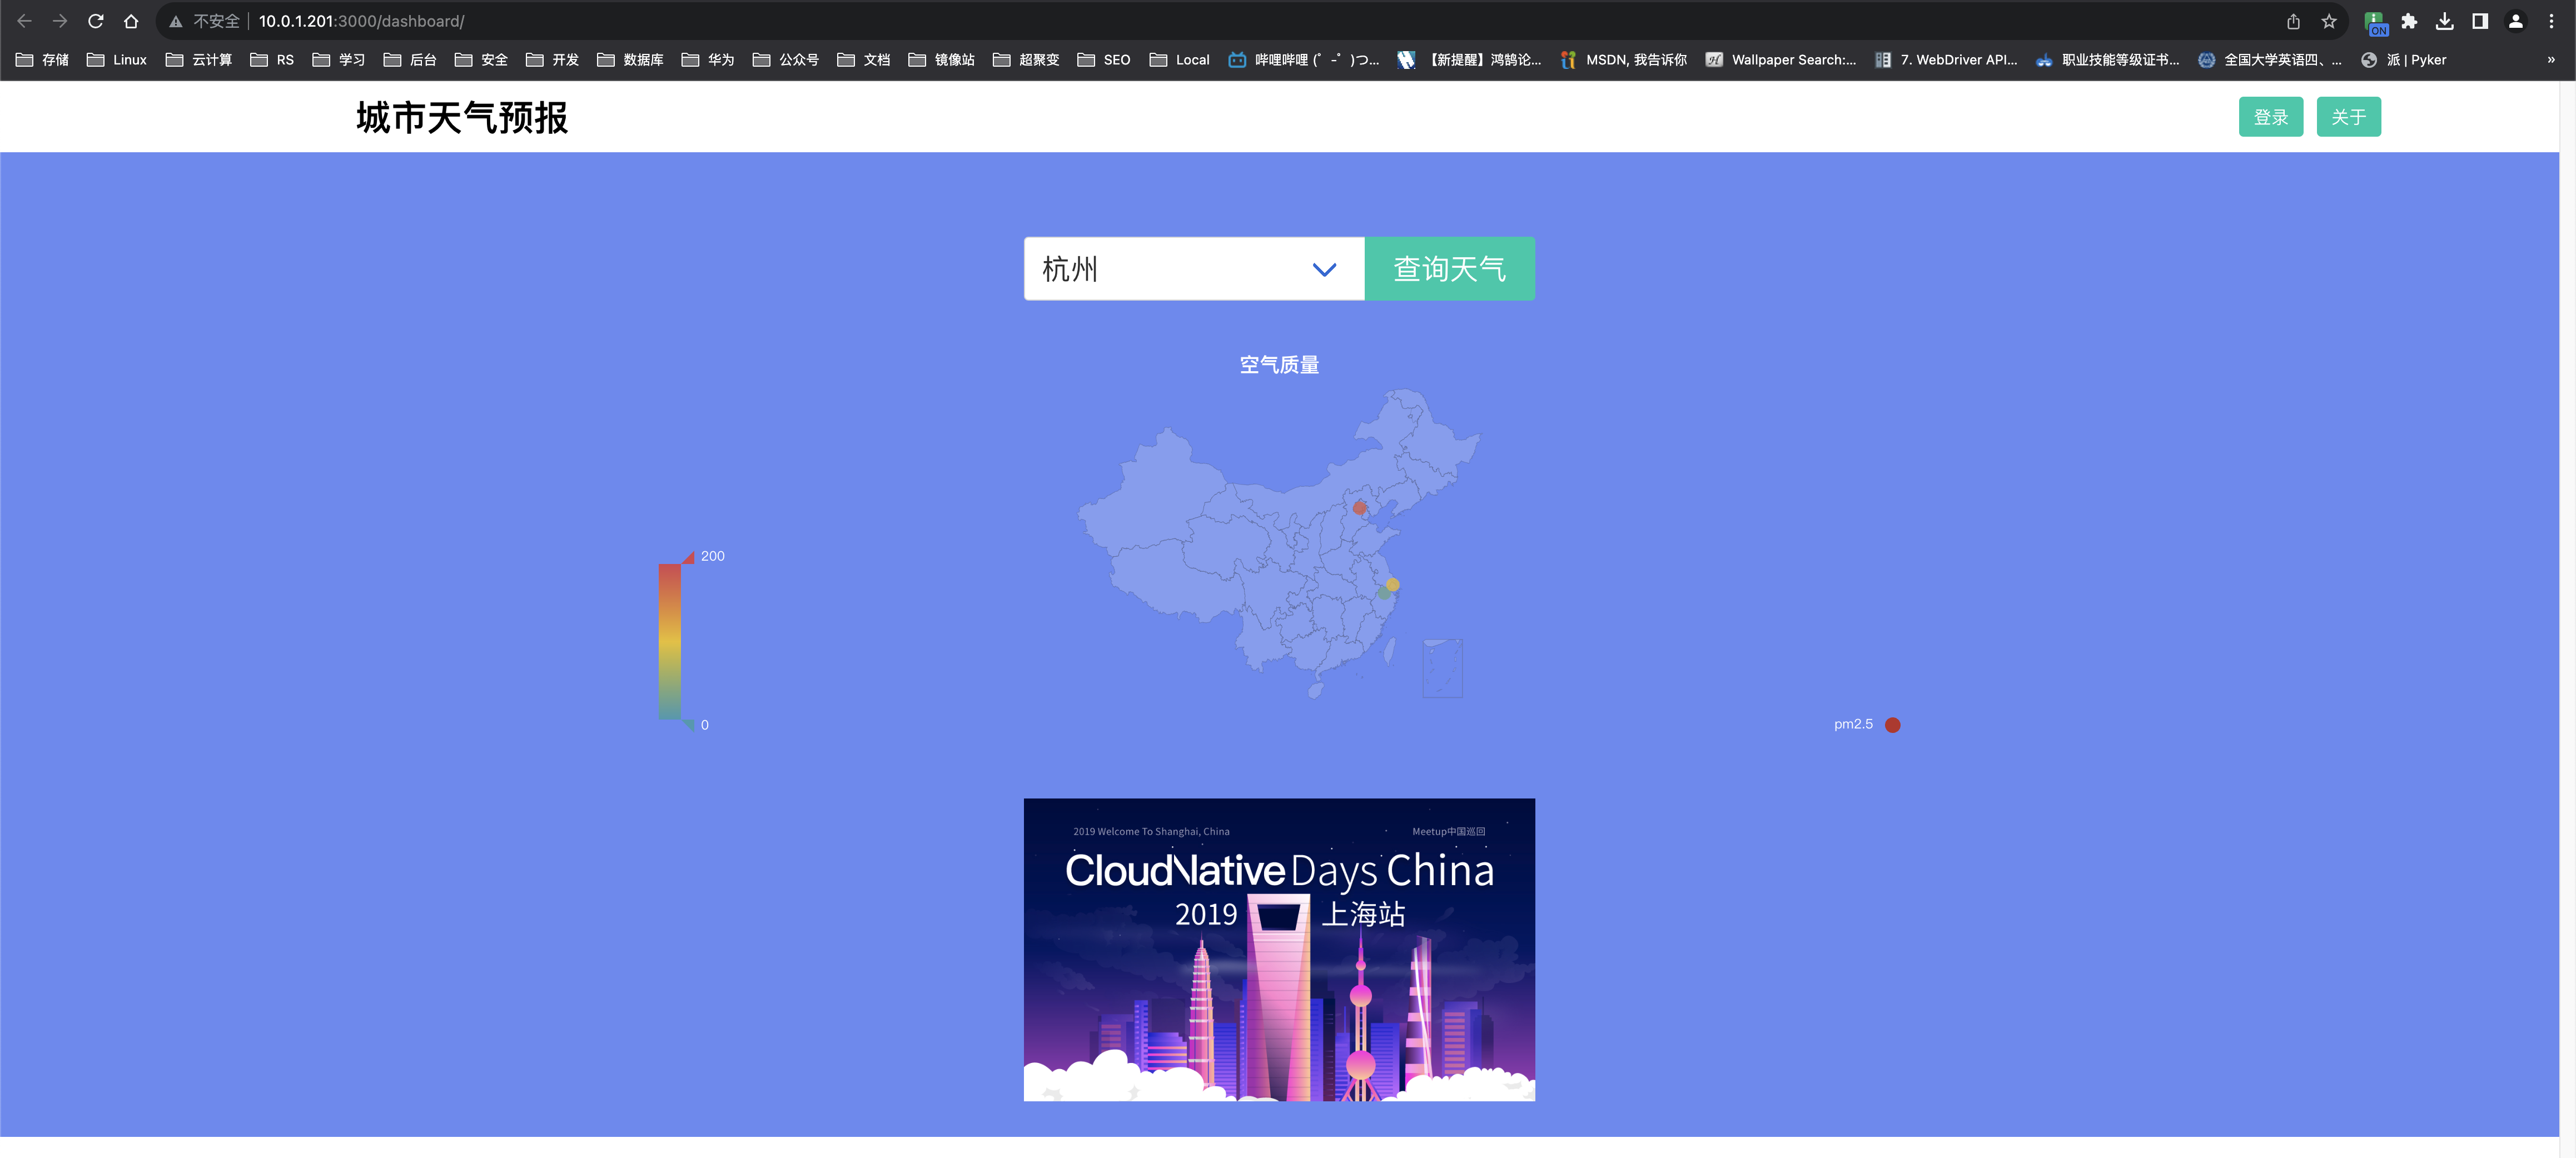
1)关于Weather Forecast
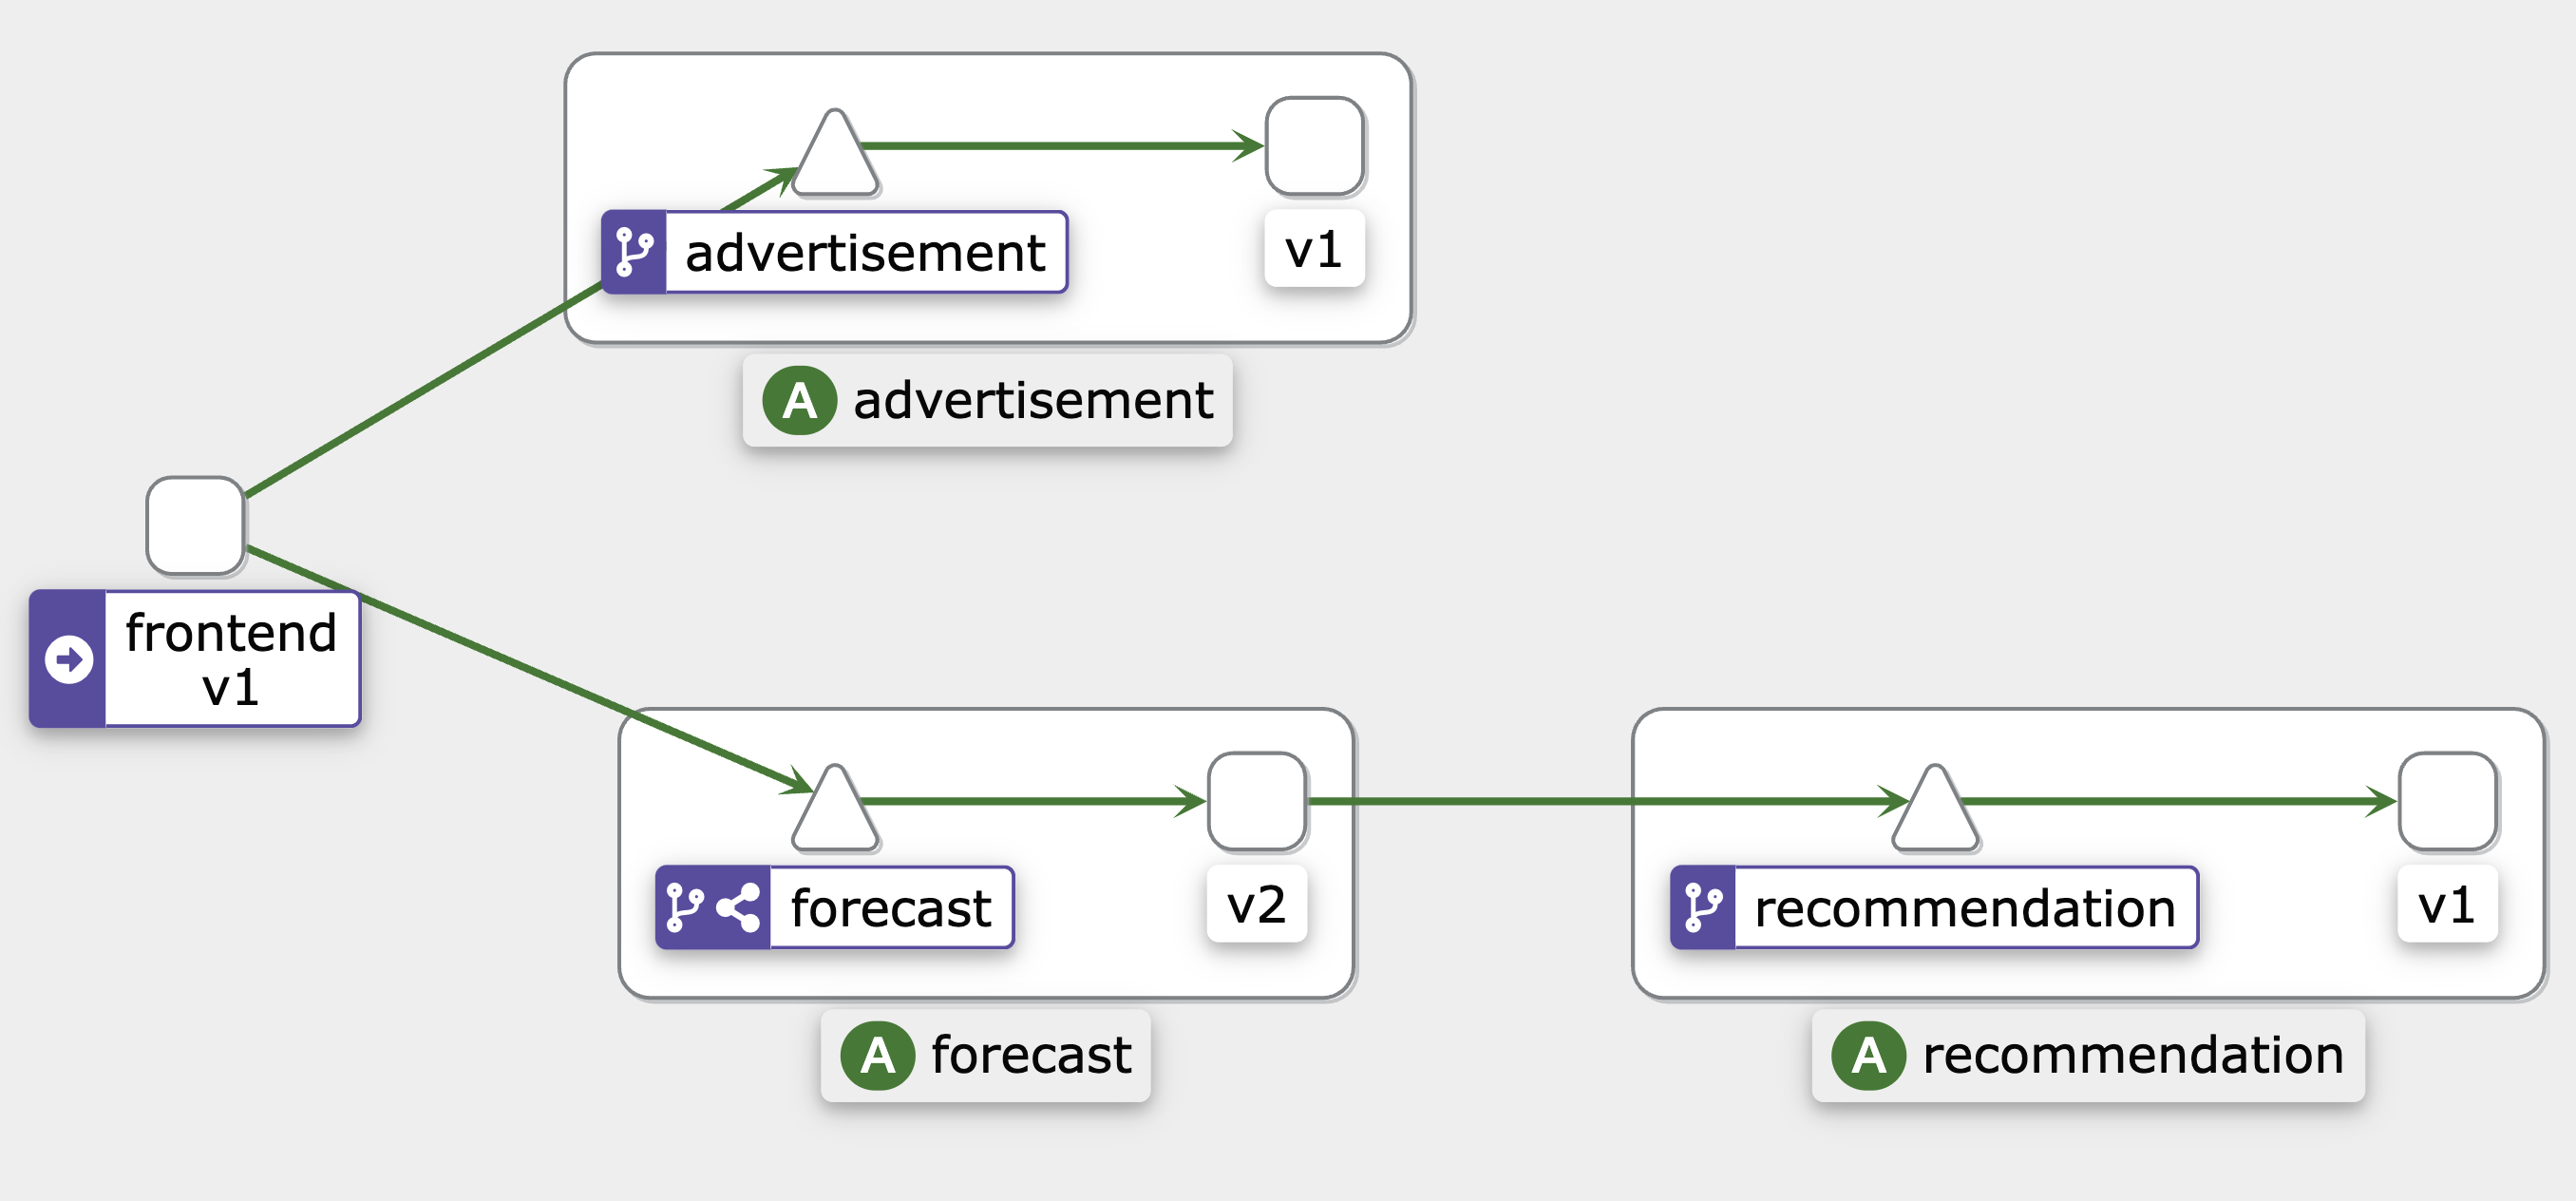
它是一款查询城市天气信息的应用实例,其展示的数据并不是真实的,只是一些静态的 dummy 数据,一共包含 4 个 微服务: frontend、advertisement、forecast 和 recommendation。
- frontend:前台服务,会调用 advertisement 和 forecast 这两个服务,展示整个应用的页面,使用 React.js 开发。
- advertisement:广告服务,返回的静态的广告图片,使用 Golang 开发而成。
- forecast:天气预报服务,返回相应城市的天气数据,使用 Node.js 开发而成。
- recommendation:推荐服务,根据天气情况向用户推荐穿衣和运动等信息,使用 Java 开发而成。
frontend 服务的有两个版本。
- v1 版本的界面按钮为绿色。
- v2 版本的界面按钮为蓝色。
forecast 服务有两个版本。
- v1 版本会直接返回天气信息。
- v2 版本会请求 recommendation 服务,获取推荐信息,并结合天气信息一起返回数据。
2)部署示例应用
下载示例应用相关源码:
$ git clone https://github.com/aminglinux/cloud-native-istio.git创建weather命名空间
$ kubectl create ns weather给weather命名空间打标签,目的是让该命名空间下的应用可以让Istio注入
$ kubectl label namespace weather istio-injection=enabled部署示例应用
$ kubectl apply -f cloud-native-istio/08_environment/8.3/weather-v1.yaml -n weather说明:weather-v1.yaml只安装了frontend、advertisement、forecast这3个服务的v1版本,不包含它们的v2版本和recommendation。
查看pod状态
$ kubectl get po -n weather

NAME                                READY   STATUS    RESTARTS   AGE
advertisement-v1-86774df996-jbdcm   2/2     Running   0          3m59s
forecast-v1-7d47ddd9f7-sxdhd        2/2     Running   0          3m59s
frontend-v1-646b77fc94-4bp87        2/2     Running   0          4m
查看svc状态
kubectl get svc -n weather
NAME            TYPE        CLUSTER-IP      EXTERNAL-IP   PORT(S)    AGE
advertisement   ClusterIP   10.15.203.234   <none>        3003/TCP   4m53s
forecast        ClusterIP   10.15.11.136    <none>        3002/TCP   4m53s
frontend        ClusterIP   10.15.224.80    <none>        3000/TCP   4m53s
设置对外访问
$ nohup kubectl port-forward -n weather svc/frontend --address 10.0.1.201 3000:3000 &浏览器访问:
http://10.0.1.201:3000/dashboard
4、Istio可观测性实践
我们使用Istio+Prometheus+Grafana+Kiali(istio的可视化工具)+Jaeger(类似于Skywalking)来搭建一套可观测平台。
注意:下面我用到的以上软件版本兼容Istio1.8,如果版本更新,也许不兼容。
4.1 环境准备
1)下载环境资源yaml
$ mkdir istio-addons
$ cd istio-addons
$ for f in kiali  prometheus  grafana jaeger
do
    wget https://raw.githubusercontent.com/istio/istio/release-1.18/samples/addons/${f}.yaml --no-check-certificate
done
2)部署Prometheus、Grafana、kiali、Jaeger
$ for f in `ls *.yaml`; do kubectl apply -f $f; done检测
$ kubectl get po -n istio-system

NAME                                    READY   STATUS    RESTARTS   AGE
grafana-7d4f5589fb-wsh2q                1/1     Running   0          6m31s
istio-egressgateway-69cbcfc4d-4m547     1/1     Running   0          49m
istio-ingressgateway-58857677f6-q7qgv   1/1     Running   0          49m
istiod-94c7678f6-d6k8v                  1/1     Running   0          50m
jaeger-58c79c85cd-sz4bn                 1/1     Running   0          6m31s
kiali-749d76d7bb-m72ws                  1/1     Running   0          6m30s
prometheus-5d5d6d6fc-jz5df              2/2     Running   0          6m30s
3)设置Kiali登录的用户名和密码
$ cat > kiali-secret.yaml << EOF
apiVersion: v1
kind: Secret
metadata:
  name: kiali
  namespace: istio-system
  labels:
    app: kiali
type: Opaque
data:
  username: YWRtaW4=
  passphrase: YWRtaW4=
EOF

$ kubectl apply -f kiali-secret.yaml
说明:用户名和密码都是admin
4)配置各组件对外访问
查看svc状态
$ kubectl get svc -n istio-system

NAME                   TYPE           CLUSTER-IP      EXTERNAL-IP   PORT(S)                                                                      AGE
grafana                ClusterIP      10.15.218.36    <none>        3000/TCP                                                                     7m43s
istio-egressgateway    ClusterIP      10.15.245.206   <none>        80/TCP,443/TCP                                                               50m
istio-ingressgateway   LoadBalancer   10.15.145.77    <pending>     15021:32167/TCP,80:30990/TCP,443:30910/TCP,31400:32249/TCP,15443:30026/TCP   50m
istiod                 ClusterIP      10.15.182.190   <none>        15010/TCP,15012/TCP,443/TCP,15014/TCP                                        51m
jaeger-collector       ClusterIP      10.15.77.72     <none>        14268/TCP,14250/TCP,9411/TCP                                                 7m43s
kiali                  ClusterIP      10.15.97.132    <none>        20001/TCP,9090/TCP                                                           7m42s
prometheus             ClusterIP      10.15.186.34    <none>        9090/TCP                                                                     7m42s
tracing                ClusterIP      10.15.9.161     <none>        80/TCP,16685/TCP                                                             7m43s
zipkin                 ClusterIP      10.15.87.79     <none>        9411/TCP                                                                     7m43s
使用port-forward的方式对外访问。
kiali对外端口为15029
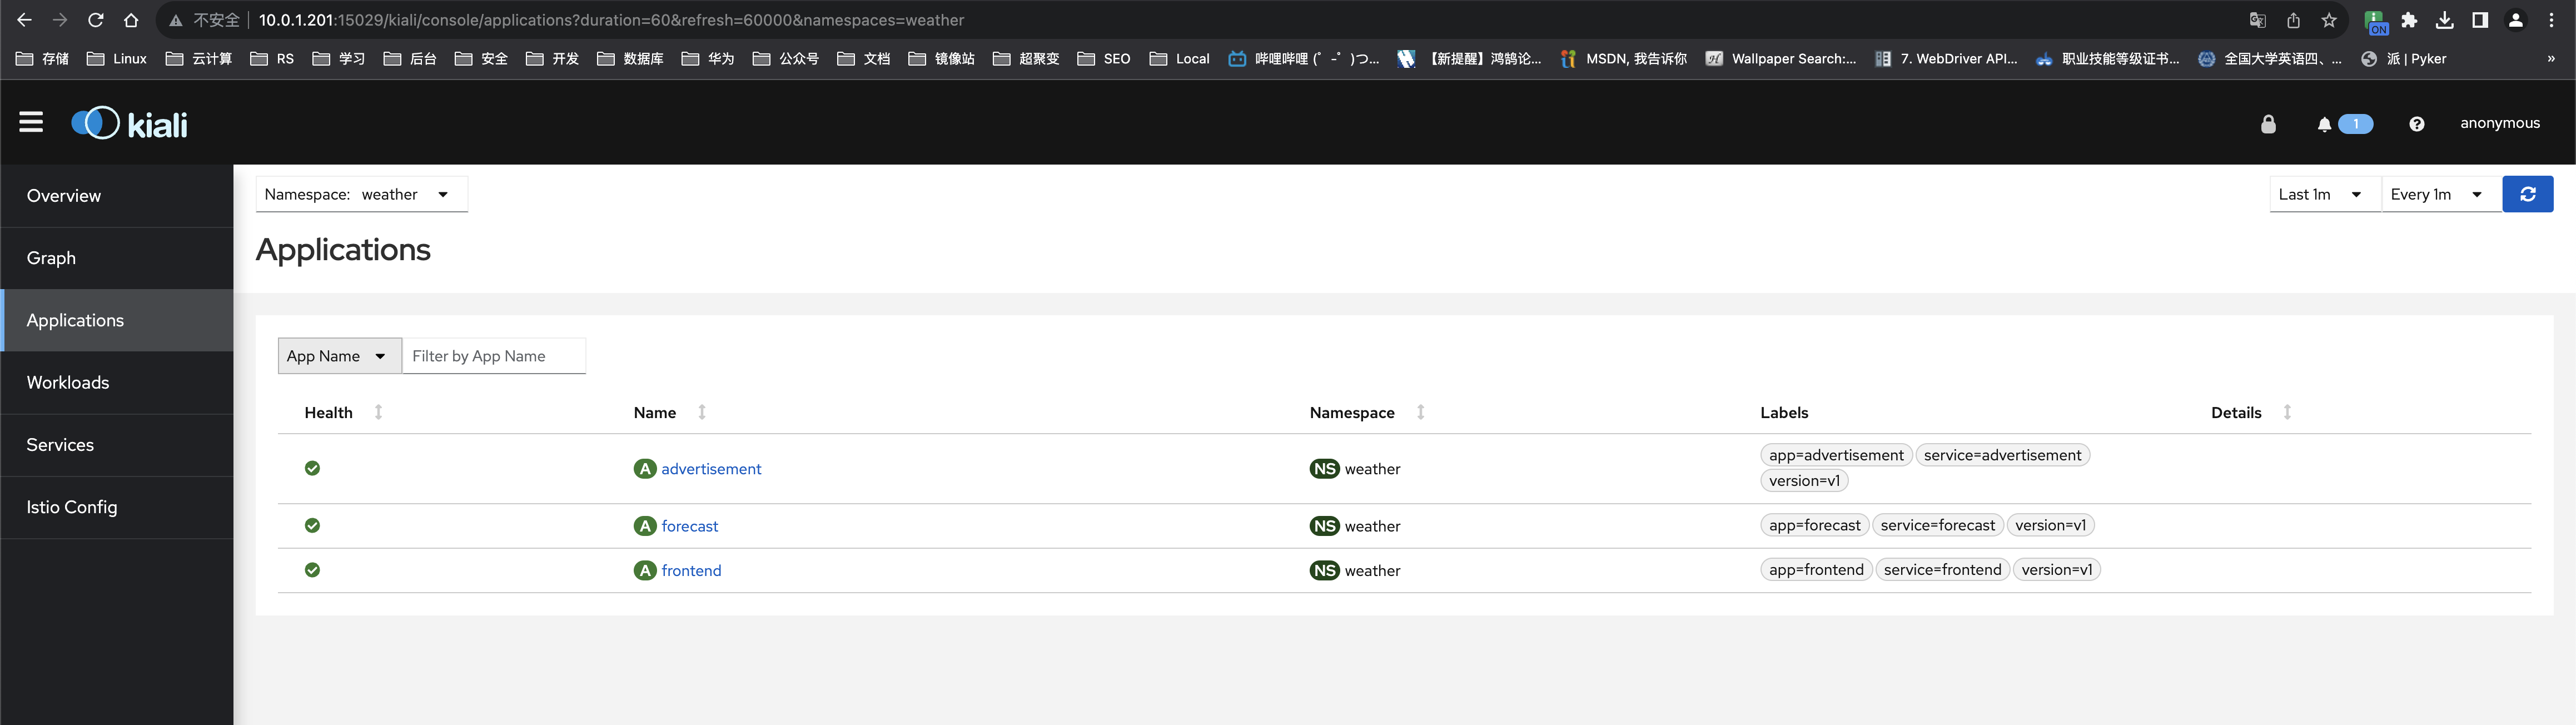
$ nohup kubectl port-forward -n istio-system svc/kiali --address 10.0.1.201 15029:20001 &浏览器访问kiali:
http://10.0.1.201:15029/kiali
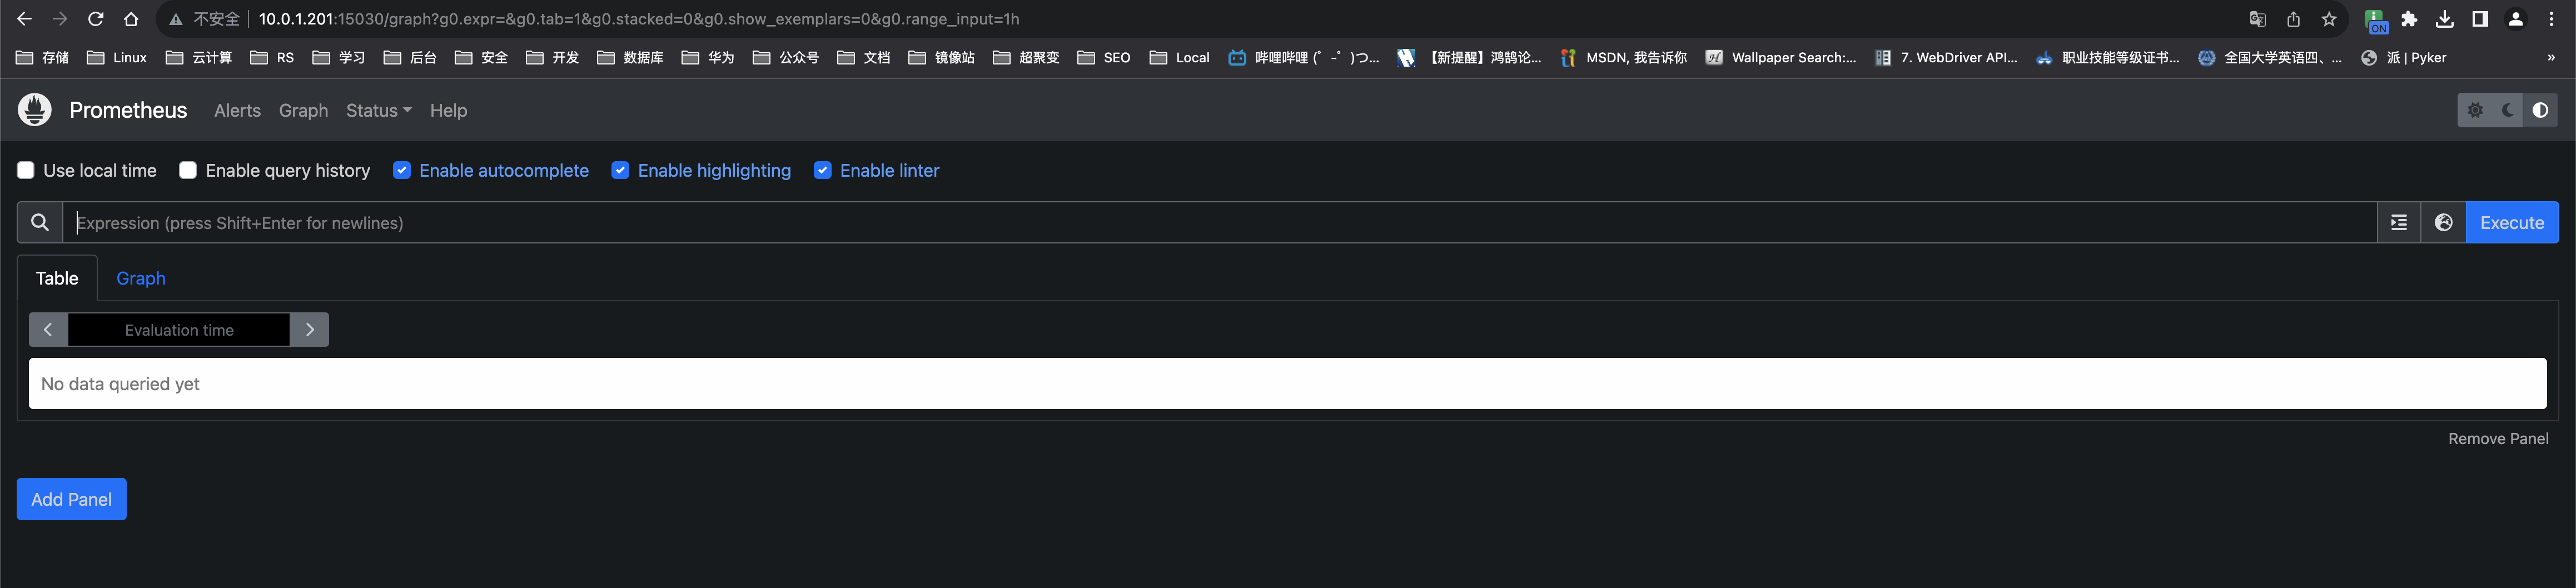
prometheus对外访问端口为15030
$ nohup kubectl port-forward -n istio-system svc/prometheus --address 10.0.1.201 15030:9090 &浏览器访问Prometheus
http://10.0.1.201:15030/
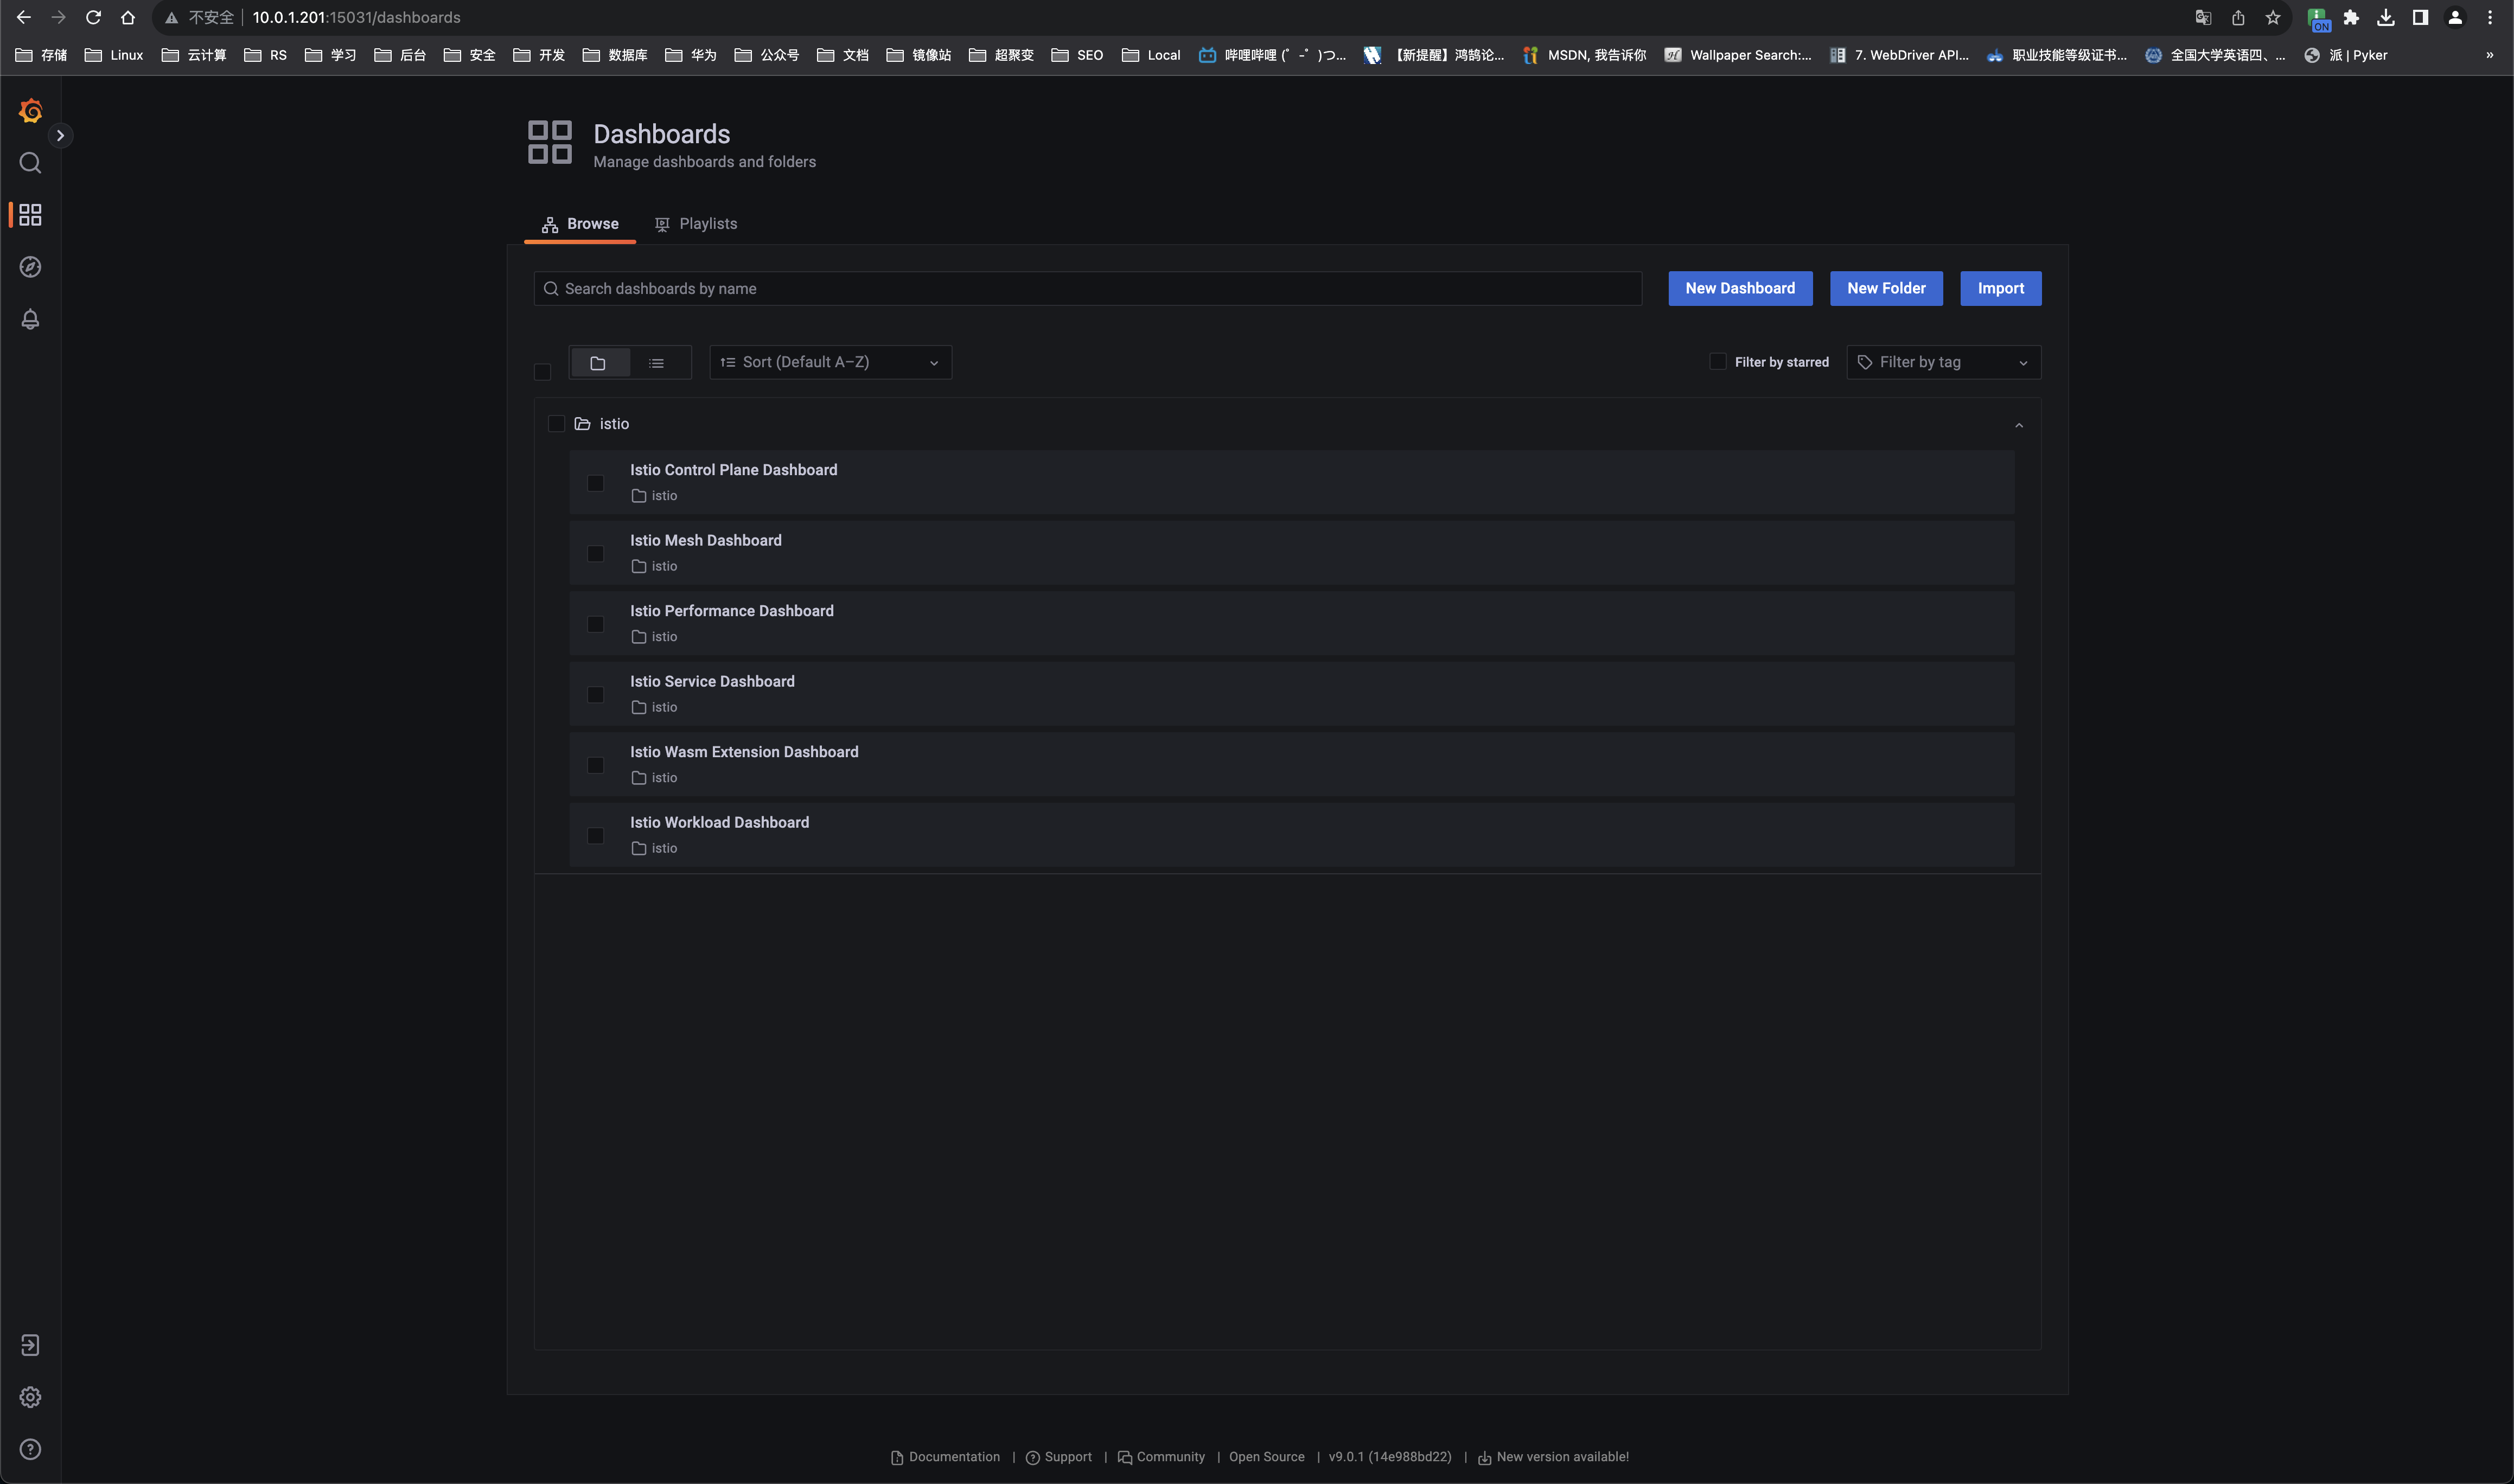
Grafana对外访问端口为15031
$ nohup kubectl port-forward -n istio-system svc/grafana --address 10.0.1.201 15031:3000 &浏览器访问Grafana
http://10.0.1.201:15031/
Gaeger对外访问端口为15032
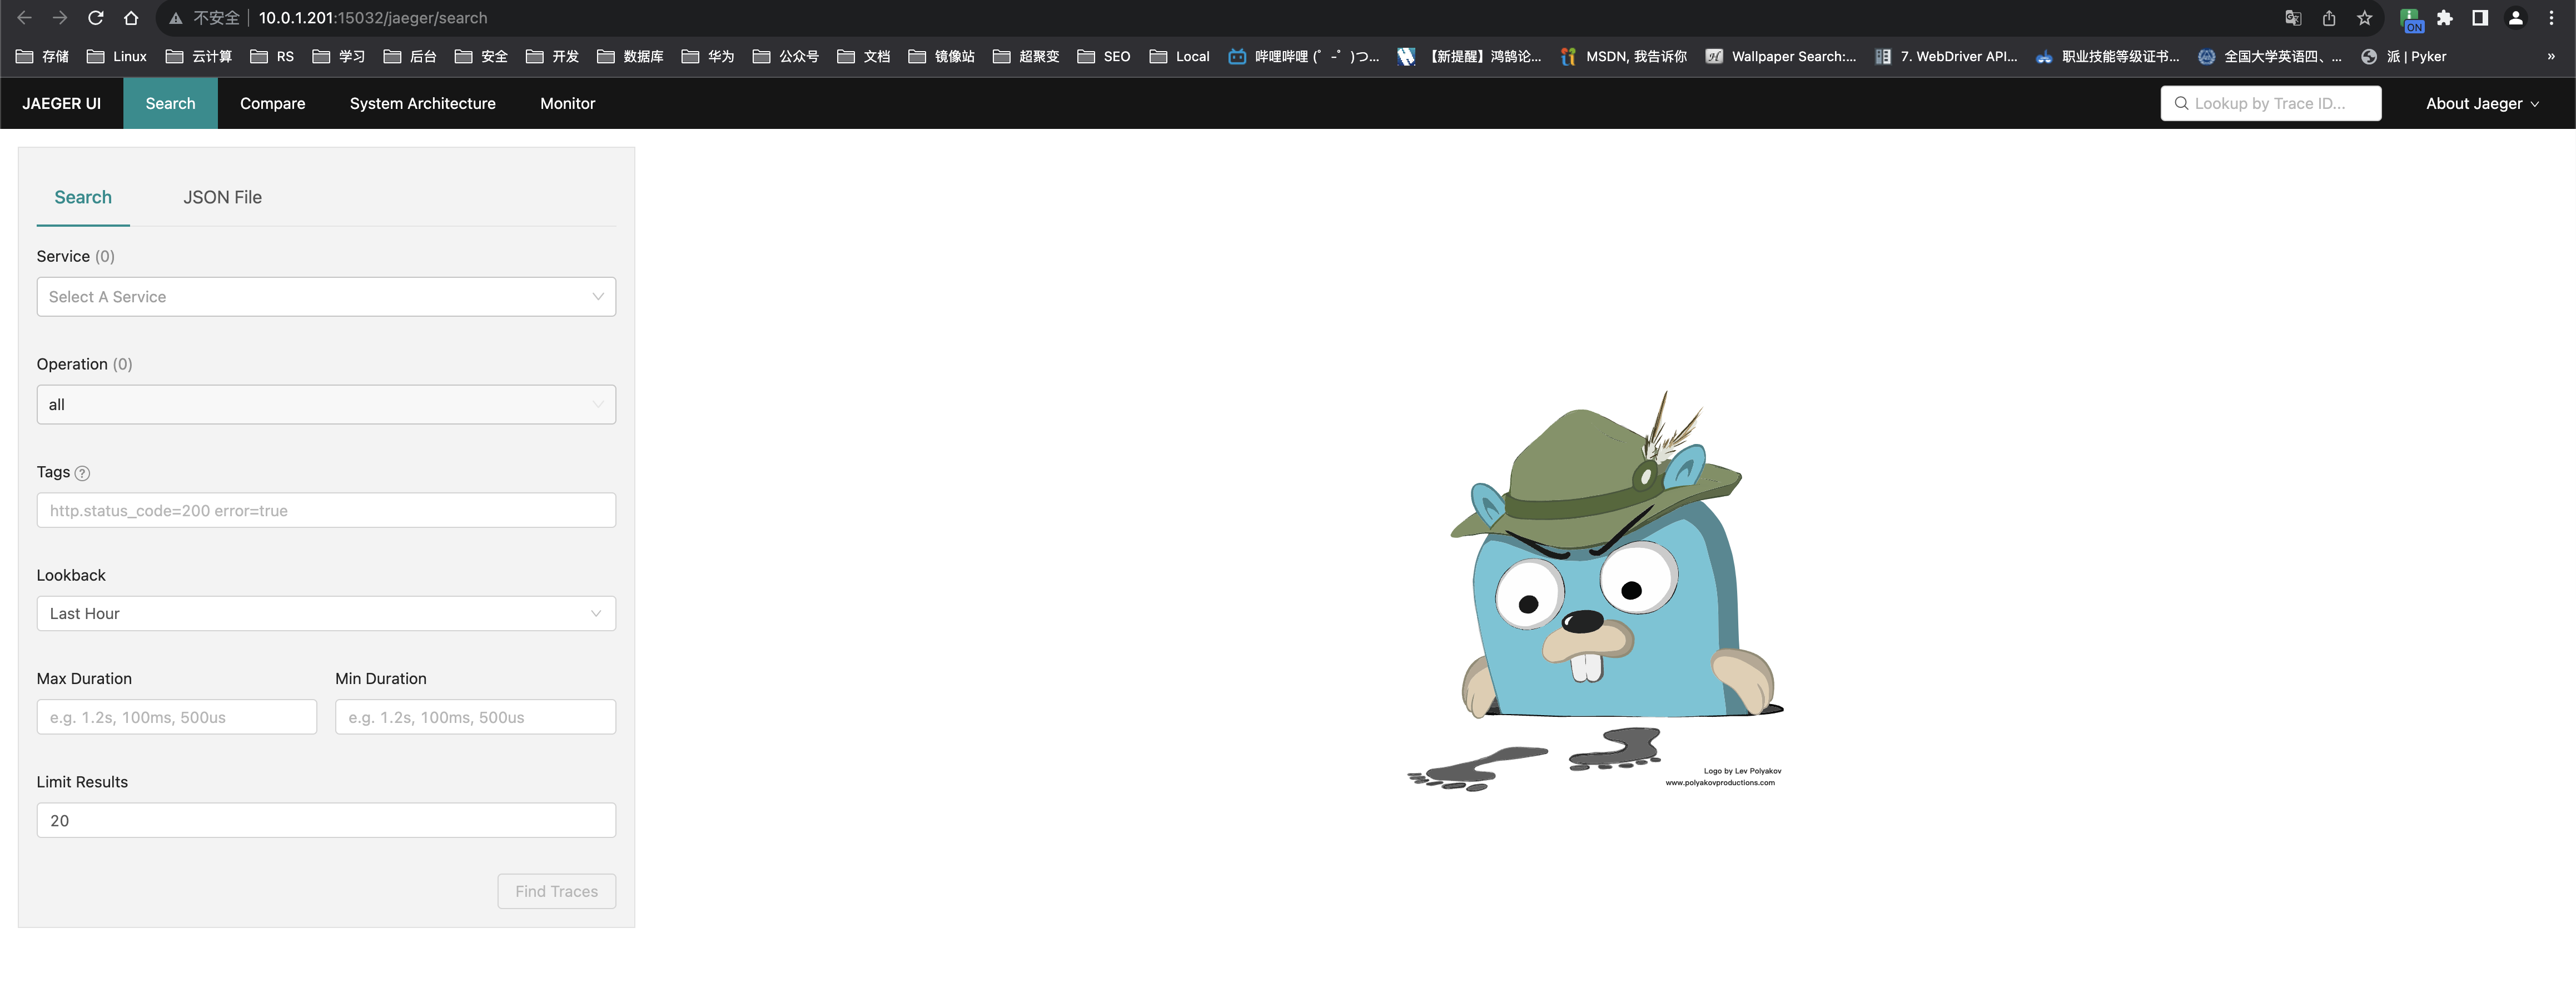
$ nohup kubectl port-forward -n istio-system svc/tracing --address 10.0.1.201 15032:80 &浏览器访问Gaeger
http://10.0.1.201:15032
4.2 调用链跟踪
直接浏览器访问前面部署的测试应用
http://10.0.1.201:9080
说明:随便点一点即可
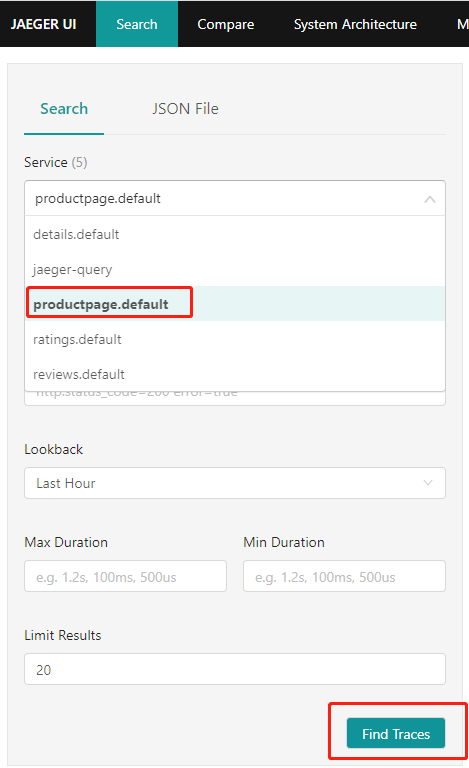
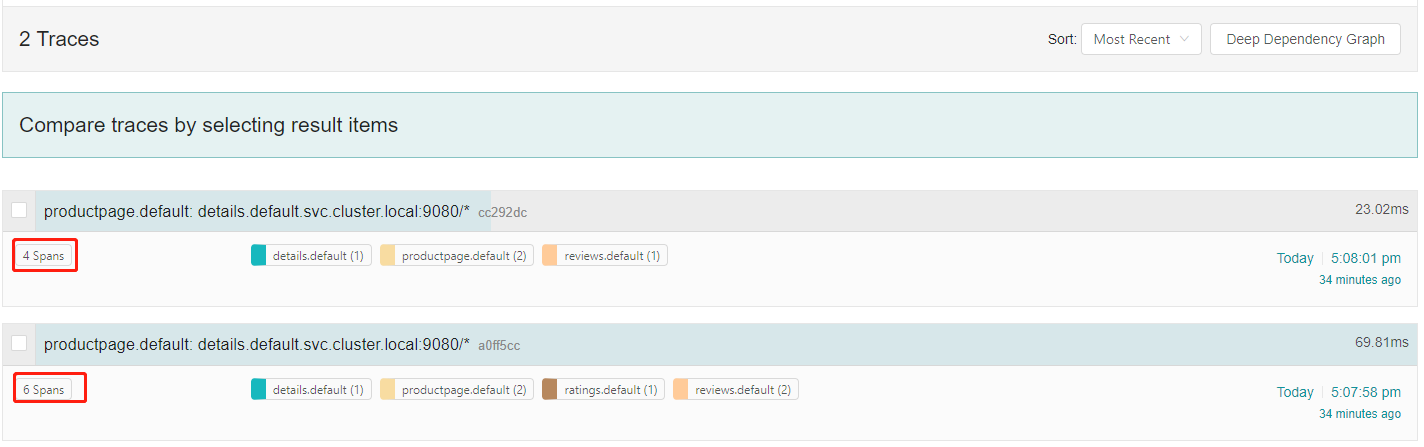
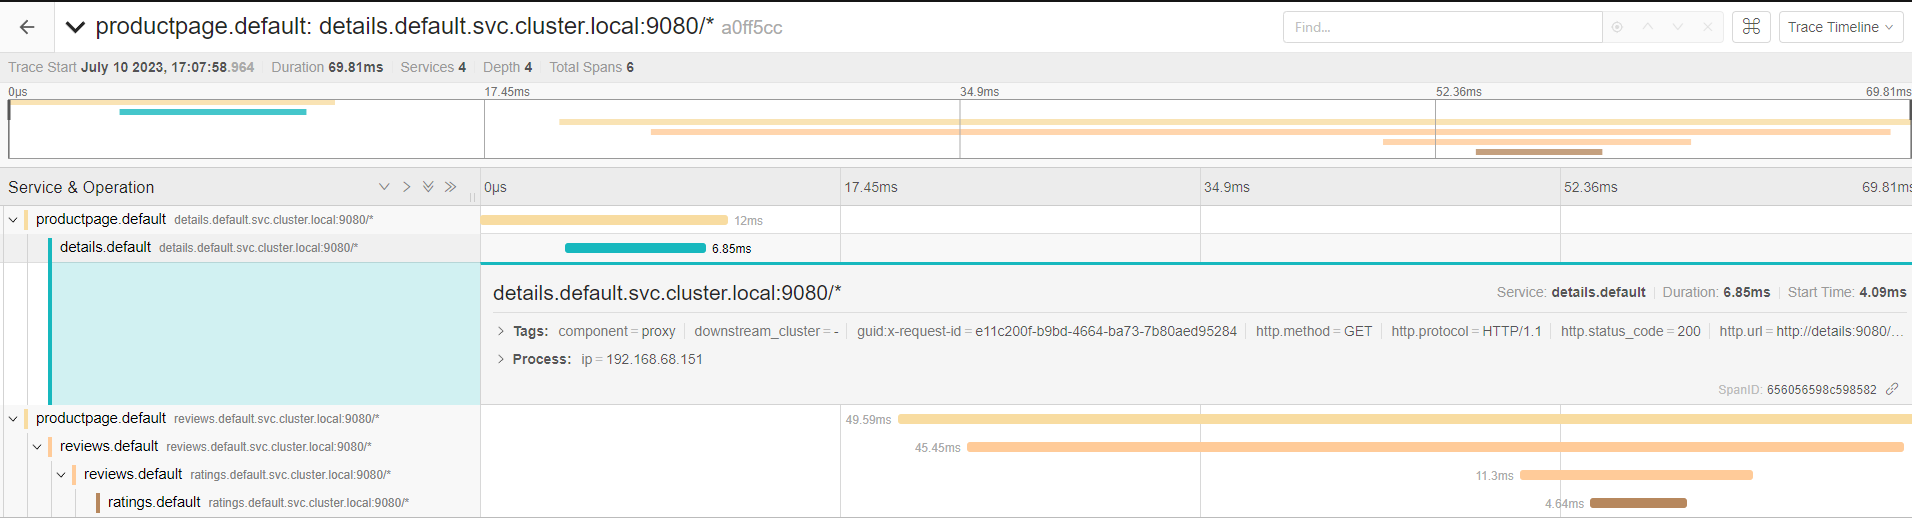
然后访问Jaeger
http://10.0.1.201:15032
4.3 指标监控
1)访问Prometheus
http://10.0.1.201:15030/
将Prometheus的Configmap导出
$ kubectl get cm prometheus -n istio-system -o yaml > promethes_istio.yaml编辑yaml
$ vi promethes_istio.yaml  #####在 scrape_configs: 下面增加,如下

    - job_name: 'istio-mesh'
      scrape_interval: 5s
      kubernetes_sd_configs:
      - role: endpoints
      relabel_configs:
      - source_labels: [__meta_kubernetes_service_name, __meta_kubernetes_endpoint_port_name]
        action: keep
        regex: istio-telemetry;prometheus
使其生效
$ kubectl -n istio-system apply -f promethes_istio.yaml #重新应用配置
$ kubectl get po -n istio-system |grep prometheus |awk '{print $1}' |xargs -i kubectl delete po {} -n istio-system #重启Prometheus服务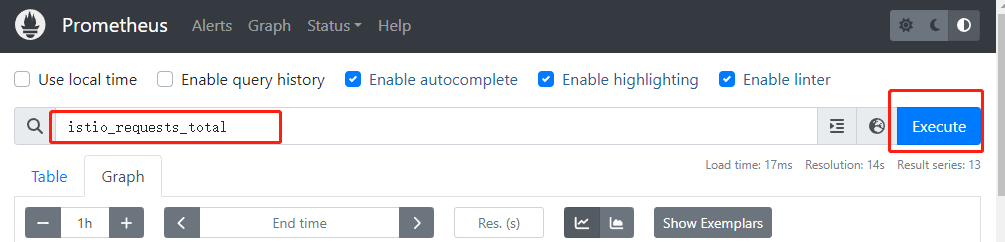
数据: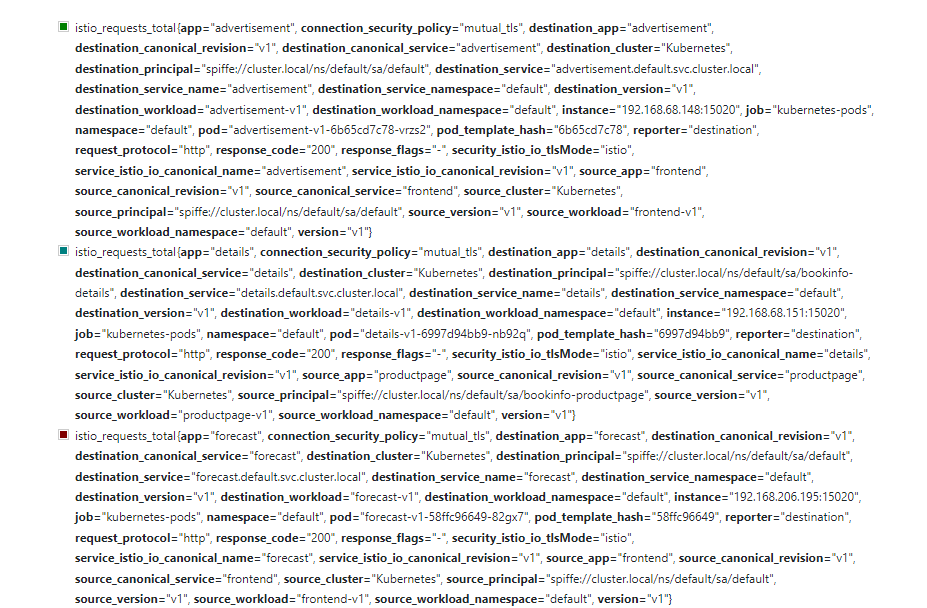
图表: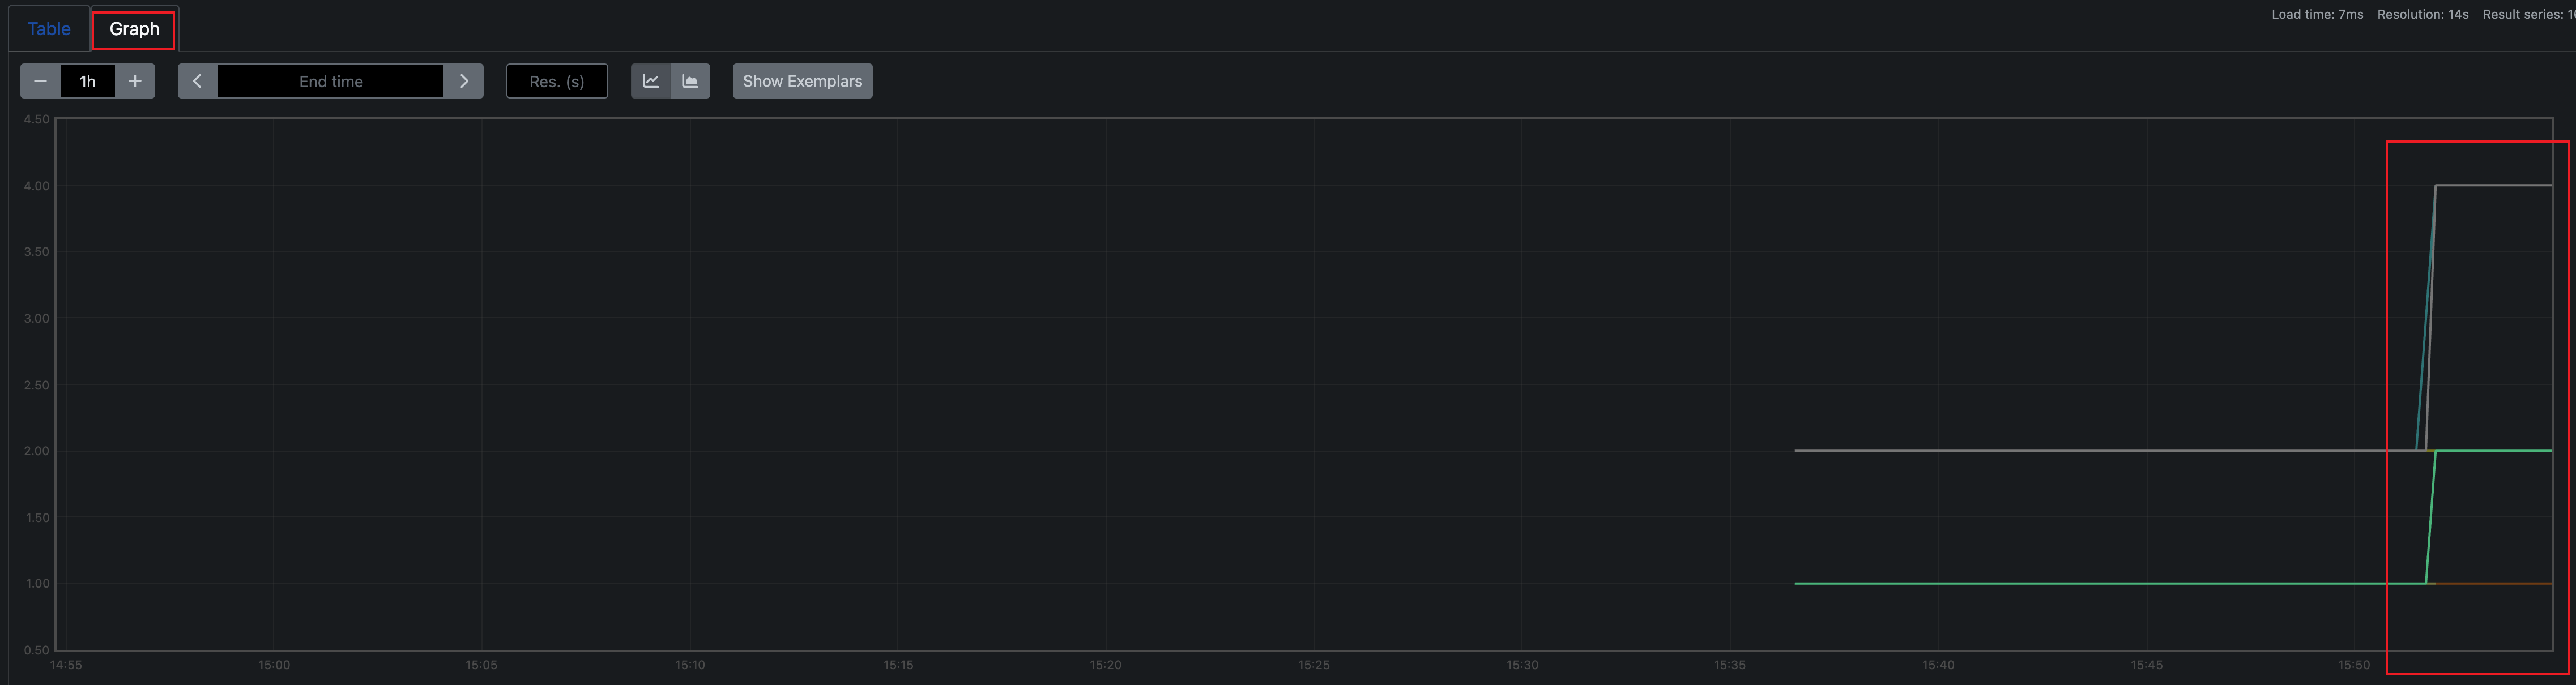
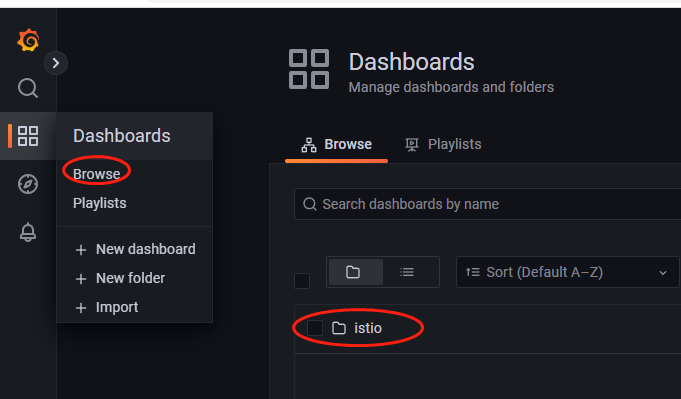
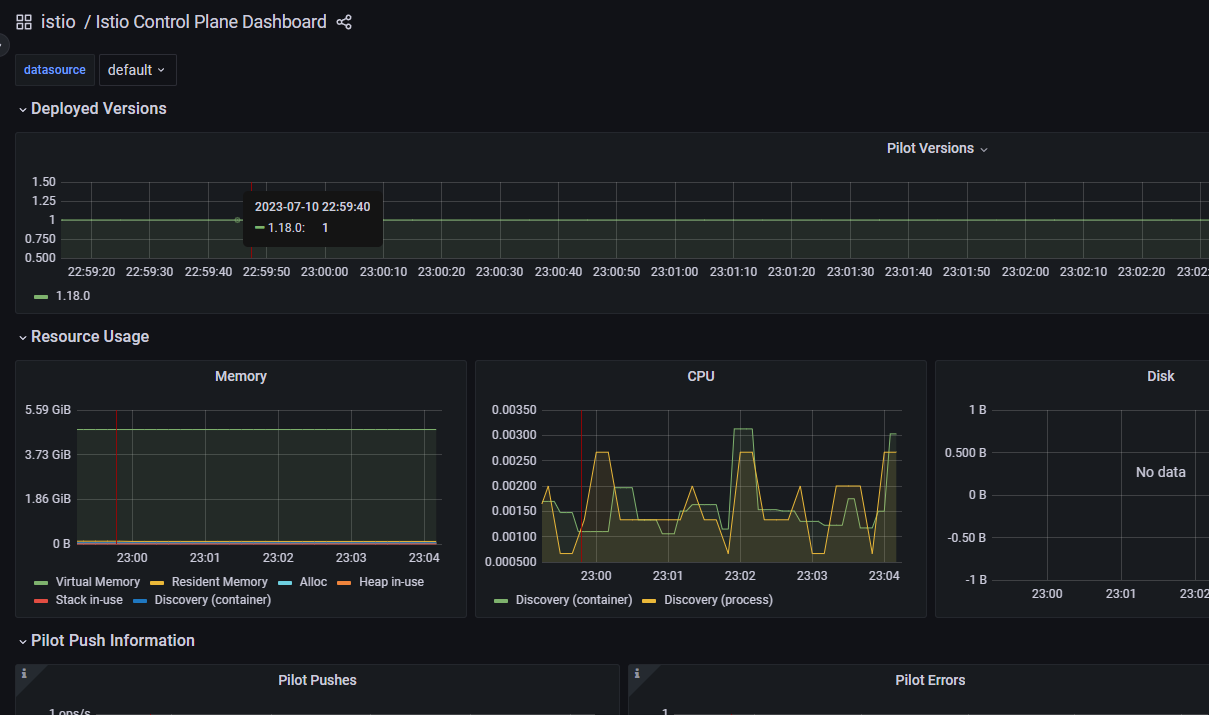
2)仪表盘
访问Grafana
http://10.0.1.201:15031/
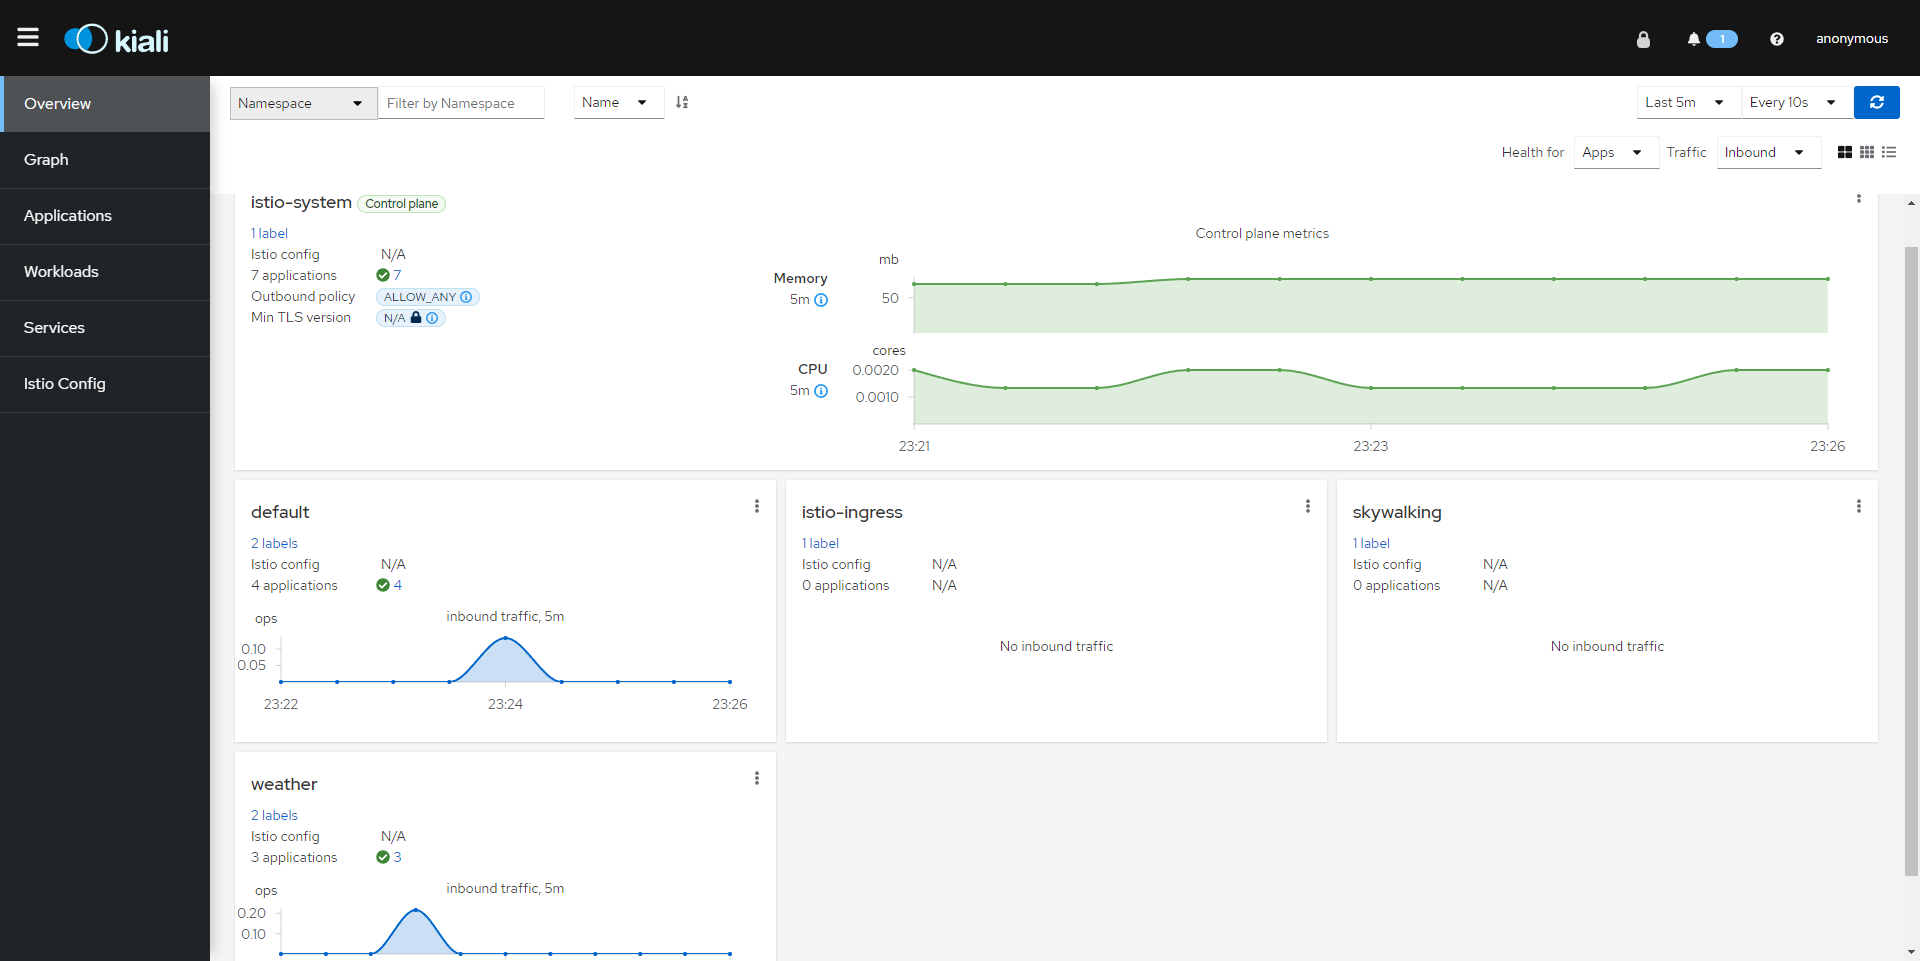
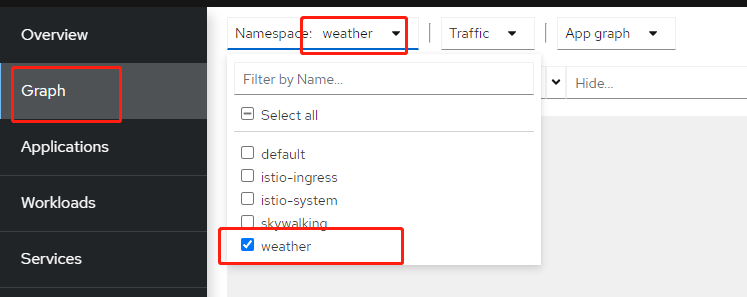
4.4 服务网格应用拓扑
这个需要通过Kiali来获取拓扑。Kiali是一个为Istio提供图形化界面和丰富观测功能的Dashboard的开源项目。它主要用来检测服务网格内部服务的实时工作状态,管理Istio的网络配置,快速识别网络问题。
http://10.0.1.201:15029/kiali
5、流量路由实践
5.1 三个概念
VirtualService、DestinationRule、Gateway
1)VirtualService:
定义对特定目标服务的一组流量规则,它将满足条件的流量转发到对应的服务后端,这个服务后端可以是一个或多个服务,也可以是DestinationRule定义的服务子集。
示例:
apiVersion: networking.istio.io/v1alpha3
kind: VirtualService
metadata:
  name: forecast-route
spec:
  hosts:  ##定义流量发送的目标地址,可以是service名字也可以是具体的IP地址,通常是service的名字。
  - forecast
  http:  ##这个字段可以是http、tcp或者tls(https)
  - match: ##定义匹配规则
    - headers:  ##匹配header中location取值为north的请求
        location:
          exact: north
    route: ##定义具体的路由规则,这里指的是当请求符合匹配规则时,走该规则
    - destination: ##定义流量被转发到哪里去
        host: forecast  ##这个host跟上面的host类似,通常也是用service名字定义
        subset: v2   ##具体规则需要在DestinationRule中定义,这里只是指定一个名字v2
  - route:
    - destination:
        host: forecast
        subset: v1
满足location取值为north则去v2,否则去v1
2)DestinationRule:
定义流量路由之后的去处,它和VirtualService配合使用,在VirtualService中定义了subsets的名字,那么在DestinationRule中定义subsets具体的内容,而且在DestinationRule里还提供了具体的流量策略。
示例:
apiVersion: networking.istio.io/v1alpha3
kind: DestinationRule
metadata:
  name: forecast-dr ##定义DestinationRule的名字
spec:
  host: forecast ##定义流量发送的目标地址,和VirtualService中的该字段含义一样
  subsets:  ##定义subsets规则
  - name: v2  ##名字是v2,和VirtualService里定义的要保持一致
    labels:
      version: v2
    trafficPolicy:  ##定义流量策略,可选字段trafficPolicy、connectionPool(连接池设置,可以实现限速或限流的效果)、outlierDetection(异常点检查,可以做熔断效果)、tls
      loadBalancer:  ##定义负载均衡算法,可选字段simple、consistentHash(一致性hash)、localityLbSetting(位置负载均衡)
        simple: ROUND_ROBIN  ##simple指的是标准负载均衡算法,可以是ROUND_ROBIN、LEAST_CONN(最少连接)、RANDOM(随机)、PASSTHROUGH(直接转发到客户端连接的目标地址,即没有做负载均衡)
  - name: v1
    labels:
      version: v1
3)Gateway:
定义外部访问的端口、协议以及与服务网格内部服务的映射关系。
示例:
apiVersion: networking.istio.io/v1alpha3
kind: Gateway
metadata:
  name: weather-gateway
  namespace: istio-system
spec:
  selector: ##负载选择器,通过它来找到执行Gateway规则的Envoy。
    istio: ingressgateway
  servers: ##定义要开放的端口、协议等信息
  - port:
      number: 80
      name: http
      protocol: HTTP
    hosts:  ##定义该Gateway发布的服务地址,支持通配*,这里的hosts定义要和VirtualService里面的hosts匹配才可以关联起来
    - "*"
定义了gateway后,然后在VirtualService里面引用
示例:
apiVersion: networking.istio.io/v1alpha3
kind: VirtualService
metadata:
  name: frontend-route
  namespace: weather
spec:
  hosts:
  - "*"
  gateways:
  - istio-system/weather-gateway
  http:
  - match:
    - port: 80
    route:
    - destination:
        host: frontend
        port:
          number: 3000
        subset: v1
5.2 准备工作
1)确保已经部署了weather应用的v1版本
$ kubectl get po -n weather

NAME                                READY   STATUS    RESTARTS   AGE
advertisement-v1-86774df996-jbdcm   2/2     Running   0          23h
forecast-v1-7d47ddd9f7-sxdhd        2/2     Running   0          23h
frontend-v1-646b77fc94-4bp87        2/2     Running   0          23h
进入我们之前git clone的目录
$ cd cloud-native-istio/10_canary-release/10.1对所有服务创建各自的VirtualService和DestinationRule资源
$ kubectl apply -f virtual-service-v1.yaml -n weather
$ kubectl apply -f destination-rule-v1.yaml -n weather
说明:由于virtual-service-v1.yaml中有引用一个gateway资源,但我们还没有创建,所以这里会有一个错误(Kiali中可以看到)
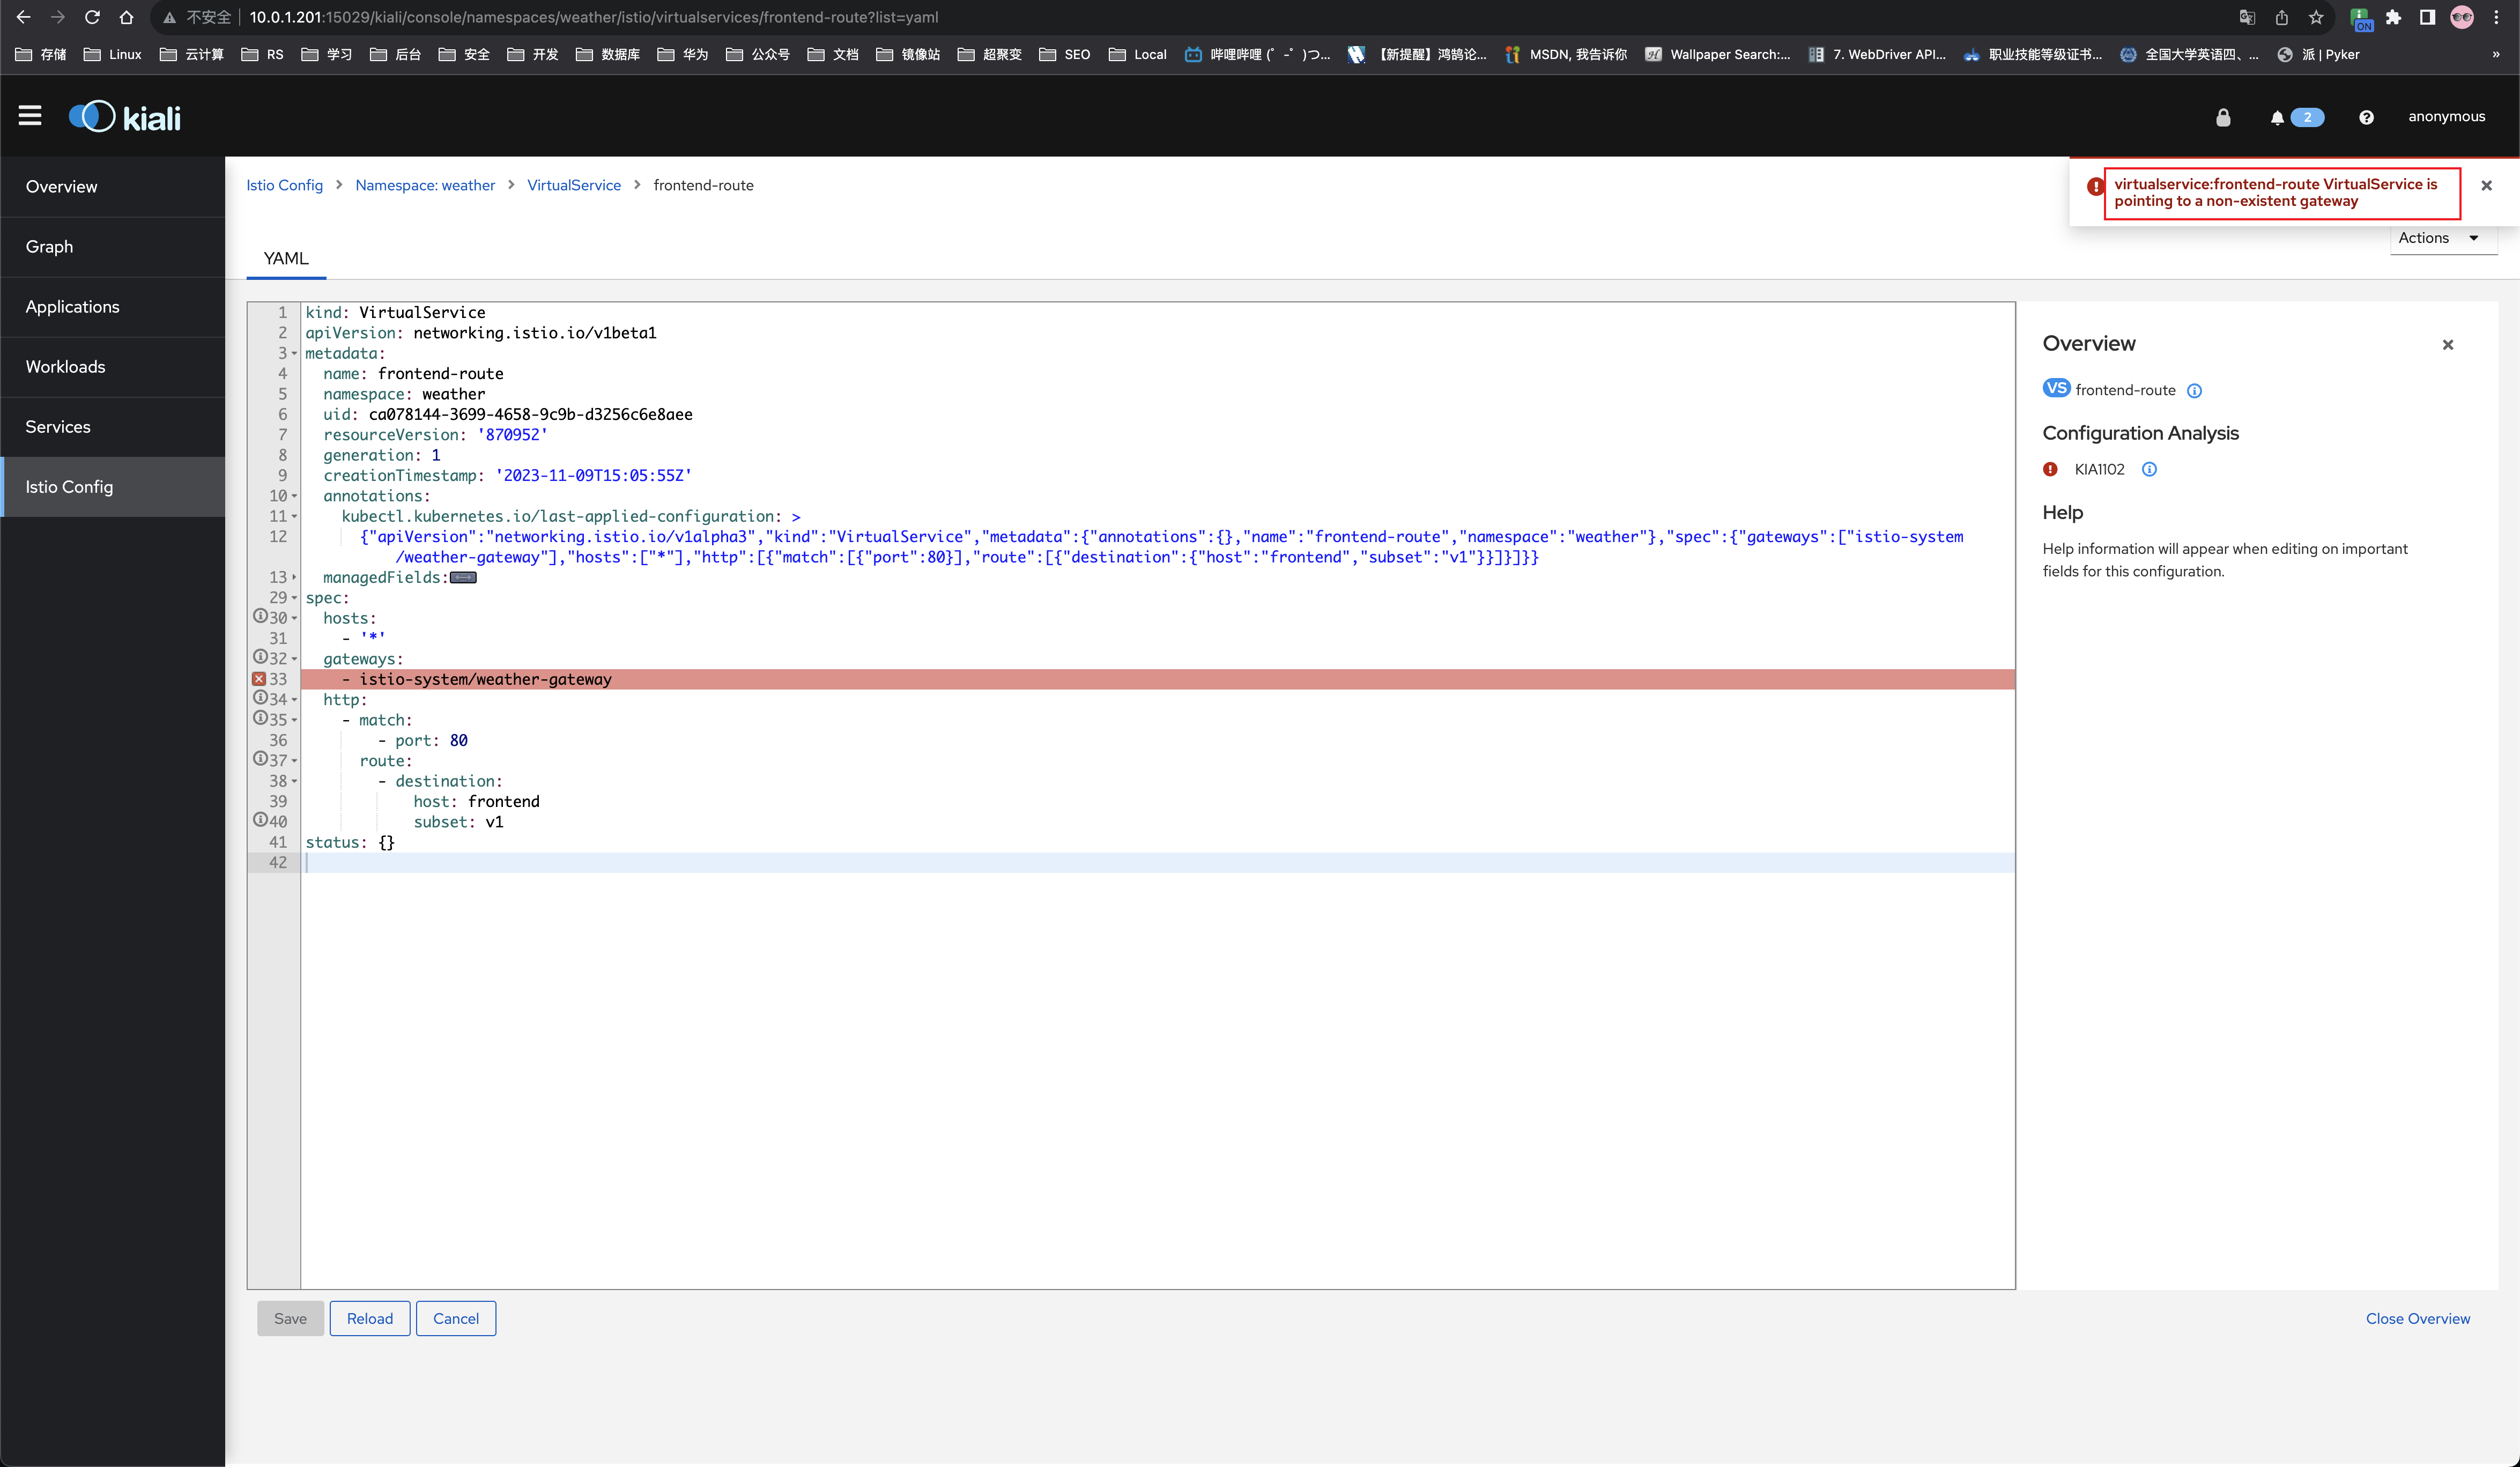
所以,还需要给它创建一下该gateway
$ cat > /tmp/weather-gateway.yaml <<EOF
apiVersion: networking.istio.io/v1alpha3
kind: Gateway
metadata:
  name: weather-gateway
  namespace: istio-system
spec:
  selector:
    istio: ingressgateway # use istio default controller
  servers:
  - port:
      number: 80
      name: http
      protocol: HTTP
    hosts:
    - "*"
EOF

$ kubectl apply -f /tmp/weather-gateway.yaml -n istio-system
查看虚拟服务和路由规则:
$ kubectl get vs -n weather

NAME                  GATEWAYS                           HOSTS               AGE
advertisement-route                                      ["advertisement"]   3m59s
forecast-route                                           ["forecast"]        3m59s
frontend-route        ["istio-system/weather-gateway"]   ["*"]               3m59s

$ kubectl get dr -n weather

NAME               HOST            AGE
advertisement-dr   advertisement   4m21s
forecast-dr        forecast        4m21s
frontend-dr        frontend        4m21s
查看vs或dr对应的内容
$ kubectl get vs advertisement-route -n weather -o yaml
apiVersion: networking.istio.io/v1beta1
kind: VirtualService
metadata:
annotations:
kubectl.kubernetes.io/last-applied-configuration: |
{"apiVersion":"networking.istio.io/v1alpha3","kind":"VirtualService","metadata":{"annotations":{},"name":"advertisement-route","namespace":"weather"},"spec":{"hosts":["advertisement"],"http":[{"route":[{"destination":{"host":"advertisement","subset":"v1"}}]}]}}
creationTimestamp: "2023-11-09T15:05:55Z"
generation: 1
name: advertisement-route
namespace: weather
resourceVersion: "870953"
uid: c515624e-2075-4e0e-9276-1361c9d48457
spec:
hosts:
- advertisement
http:
- route:
- destination:
host: advertisement
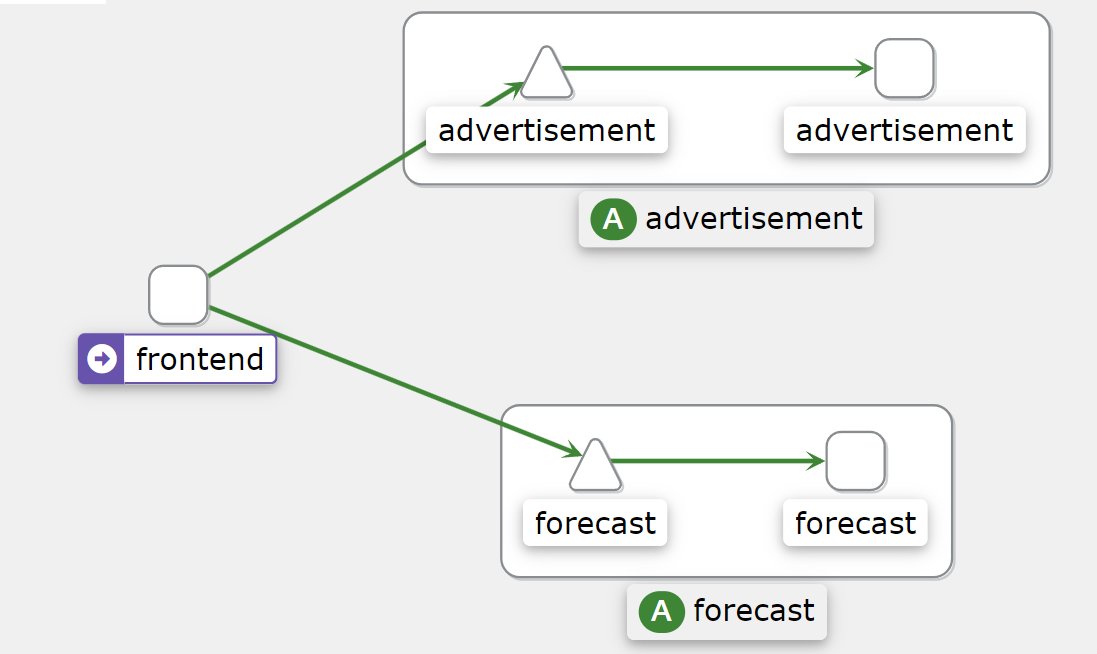
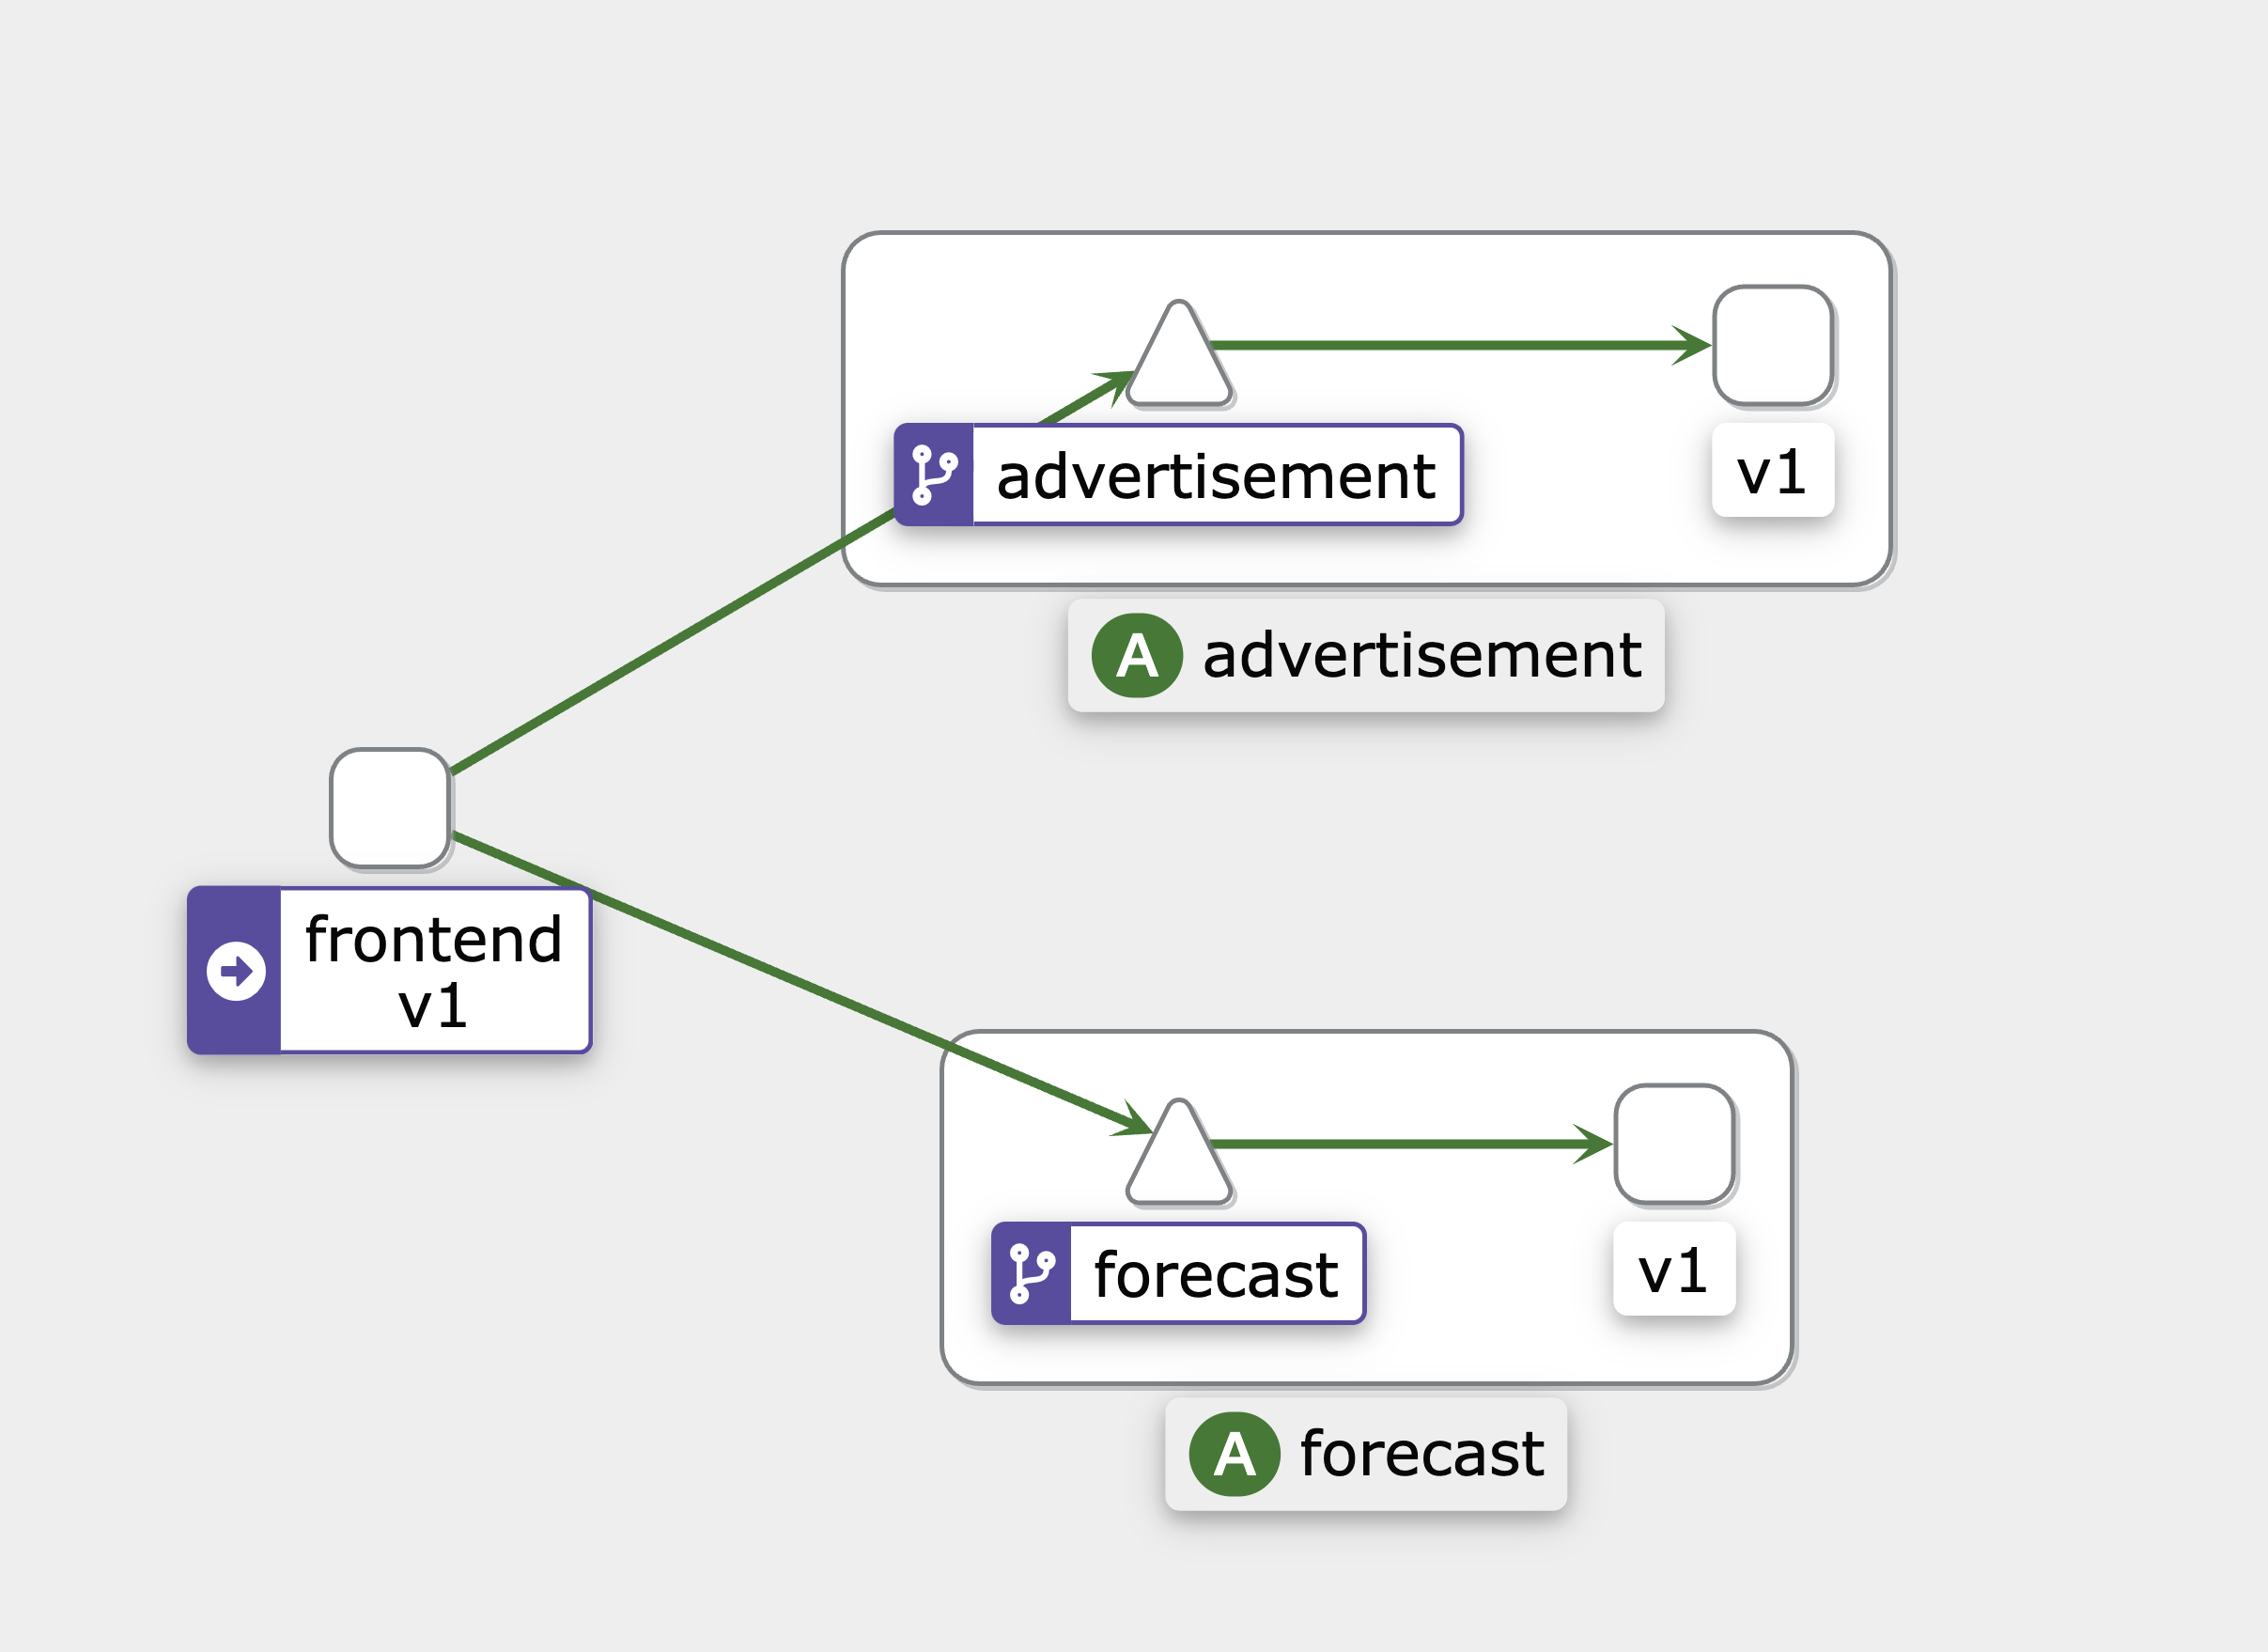
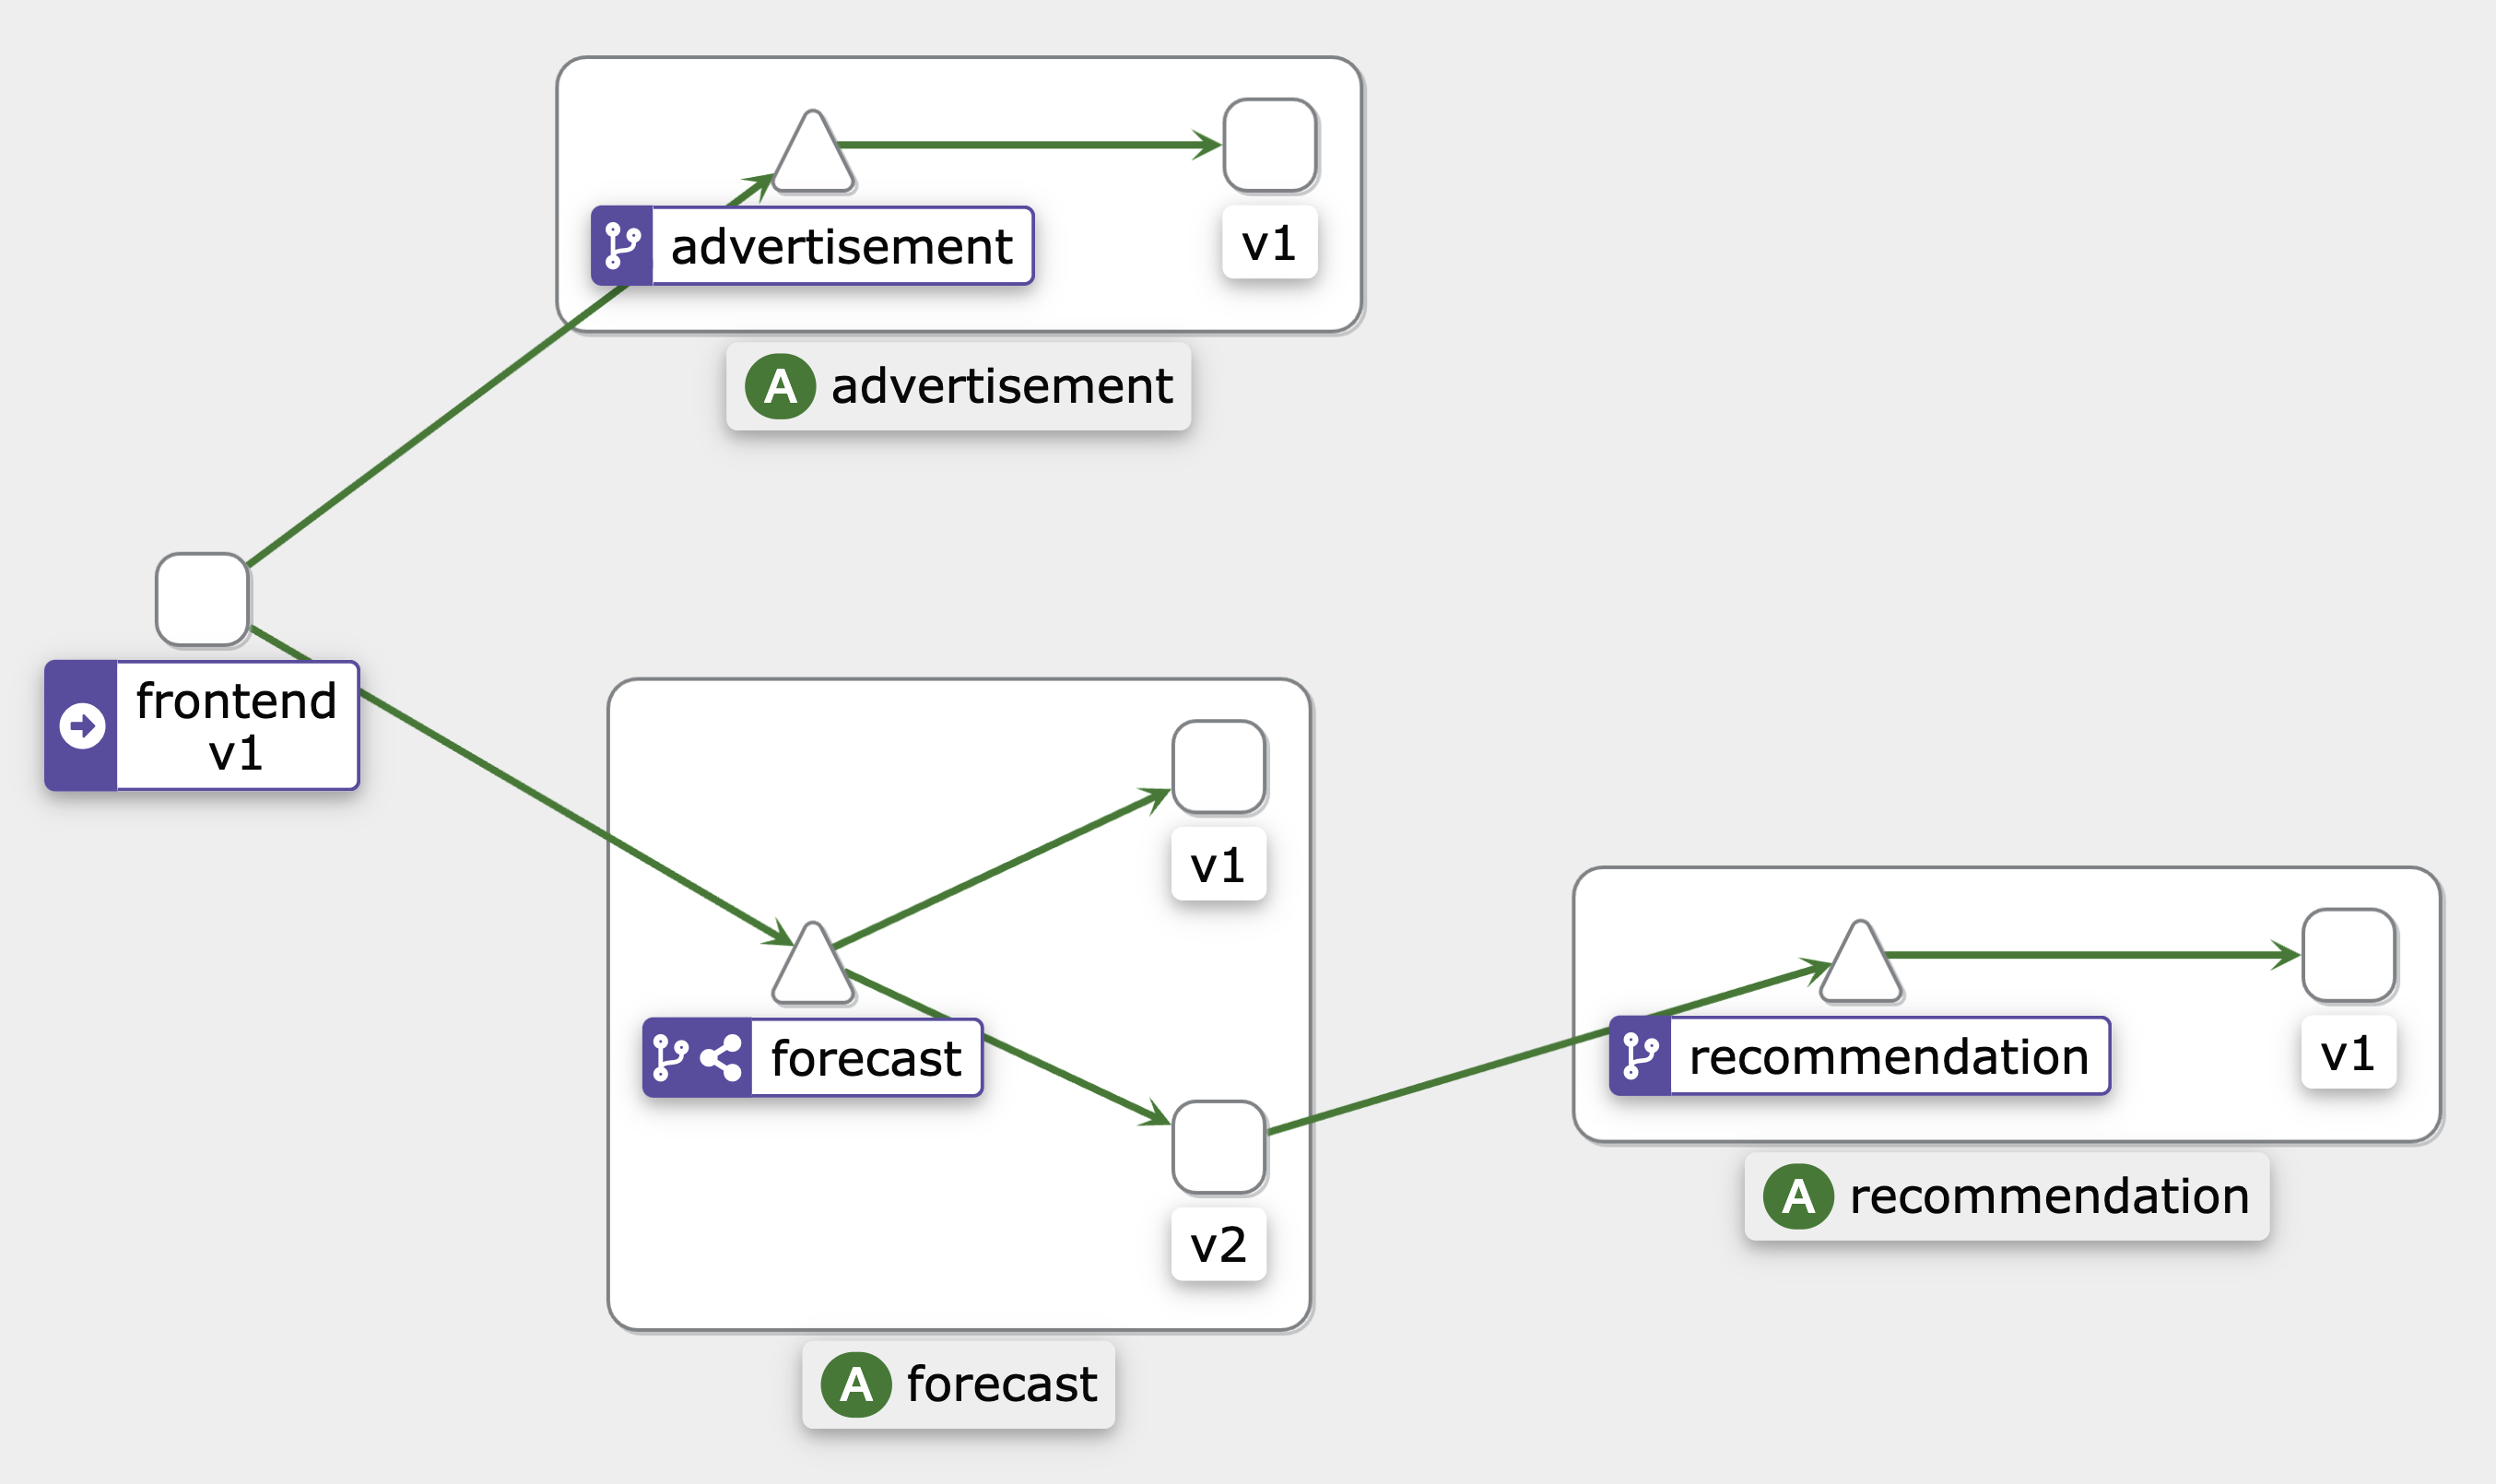
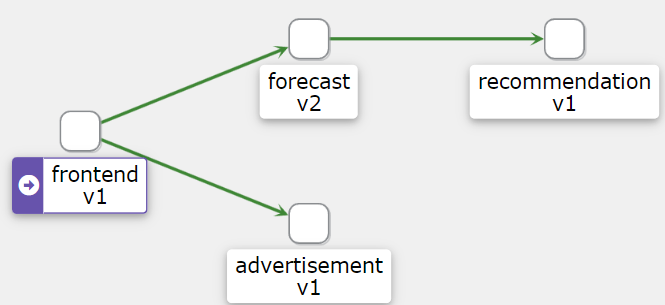
subset: v1调用链关系:
2)部署v2版本
$ cd ../10.2
$ kubectl apply -f recommendation-all.yaml -f forecast-v2-deployment.yaml -n weather
查看
$ kubectl get po -n weather

kubectl get po -n weather
NAME                                READY   STATUS    RESTARTS   AGE
advertisement-v1-86774df996-jbdcm   2/2     Running   0          24h
forecast-v1-7d47ddd9f7-sxdhd        2/2     Running   0          24h
forecast-v2-7bc797d94f-vhxjq        2/2     Running   0          2m55s
frontend-v1-646b77fc94-4bp87        2/2     Running   0          24h
recommendation-v1-c989479fd-z49vc   2/2     Running   0          2m55s
5.3 流量分发
1)目标
将frontend到forecast的流量一分为二,一半到forecast(v1)一半到forecast(v2),之后再继续更改流量比率,将v1改为0,v2改为100,从而达到灰度发布的效果。
2)更新DestinationRule
由于我们已经有到forecast的路由规则:
$ kubectl get dr forecast-dr -n weather -o yaml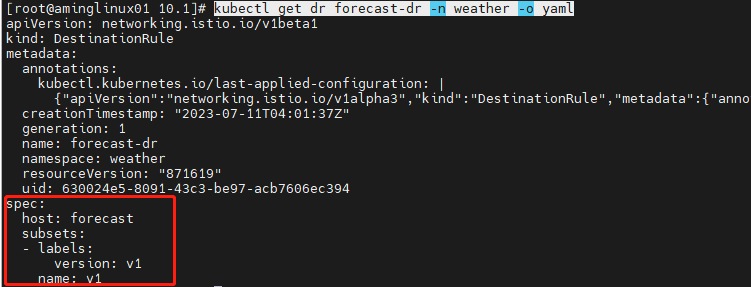
现在我们要更新一下,增加到v2的流量,可以直接apply forecast-v2-destination.yaml文件
$ kubectl apply -f forecast-v2-destination.yaml -n weather ##当前我们在cloud-native-istio/10_canary-release/10.2目录里再次查看规则:
$ kubectl get dr forecast-dr -n weather -o yaml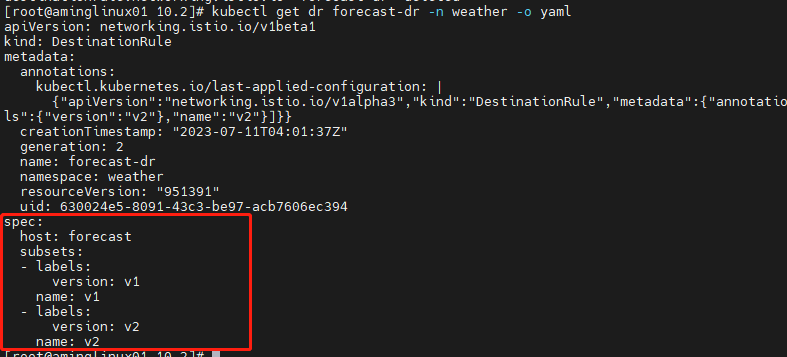
3)更新路由规则
$ kubectl apply -f vs-forecast-weight-based-50.yaml -n weather查看路由规则
$ kubectl get vs -n weather forecast-route -o yaml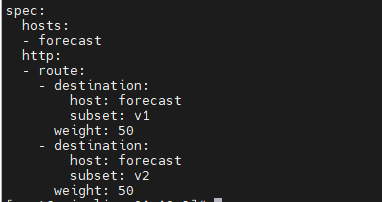
浏览器访问天气应用,查看效果
4)继续更改流量比例
$ kubectl apply -f vs-forecast-weight-based-v2.yaml -n weather查看路由规则
$ kubectl get vs -n weather forecast-route -o yaml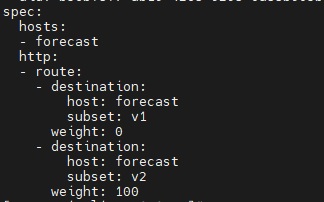
5.4 基于http的流量控制
1)基于user-agent
更改forecast的路由规则
$ cd ../10.3
$ kubectl apply -f vs-forecast-header-based.yaml -n weather
查看规则
$ kubectl get vs forecast-route -o yaml -n weather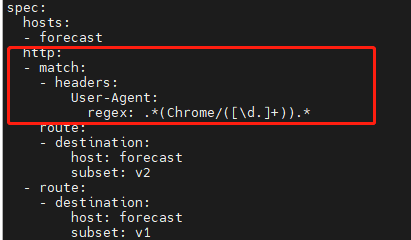
说明:浏览器user-agnet包含chrome关键词的会被转发到v2,其它浏览器会被转发到v1
测试:分别用chrome浏览器和其它浏览器来测试访问,看是否有推荐信息。

2)基于cookies
有些场景下,我们需要根据登录的用户来分发流量,例如tester用户访问v2版本的应用,而其它用户访问v1版本的应用。这个需求就可以通过http的cookie关键字匹配来创建流量路由规则。
部署frontend的v2版本应用:
$ cd ../10.5
$ kubectl apply -f frontend-v2-deployment.yaml -n weather
查看pod
$ kubectl get po -n weather

NAME                                READY   STATUS    RESTARTS   AGE
advertisement-v1-86774df996-jbdcm   2/2     Running   0          24h
forecast-v1-7d47ddd9f7-sxdhd        2/2     Running   0          24h
forecast-v2-7bc797d94f-vhxjq        2/2     Running   0          21m
frontend-v1-646b77fc94-4bp87        2/2     Running   0          24h
frontend-v2-59699cb77d-t9jd9        2/2     Running   0          62s
recommendation-v1-c989479fd-z49vc   2/2     Running   0          21m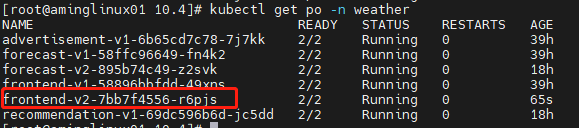
更新DestinationRule
$ kubectl apply -f frontend-v2-destination.yaml -n weather查看规则
$ kubectl get dr frontend-dr -n weather -o yaml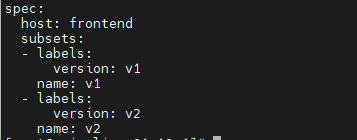
更新VirtualService
$ kubectl apply -f vs-frontend-multiservice-release.yaml -n weather查看vs路由规则
$ kubectl get vs frontend-route -n weather -o yaml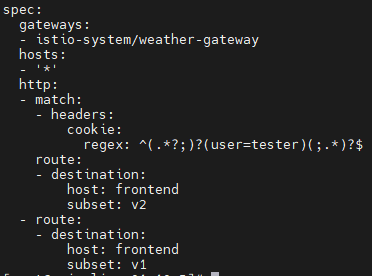
说明:该规则,会将cookie中带有user=tester关键字的请求转发到v2版本的应用里。而其它用户则转发到v1版本应用里。
6、流量治理实践
流量治理是服务网格的核心能力,该章节会讲述:Istio的负载均衡策略、会话保持、故障注入、限流、熔断等功能
6.1 负载均衡策略
1)ROUND_ROBIN负载均衡(针对DestinationRule)
这个很容易理解,就是纯粹的轮询负载均衡算法,它不管后端的服务是否忙闲,非常公平地把流量均分给发送到后端。
我们可以将advertisement服务扩展到两个pod:
$ kubectl edit deploy advertisement-v1 -n weather ##将replicas: 1改为replicas: 2查看pod
$ kubectl get po -n weather

NAME                                READY   STATUS    RESTARTS   AGE
advertisement-v1-86774df996-9t67q   2/2     Running   0          2m26s
advertisement-v1-86774df996-jbdcm   2/2     Running   0          24h
forecast-v1-7d47ddd9f7-sxdhd        2/2     Running   0          24h
forecast-v2-7bc797d94f-vhxjq        2/2     Running   0          32m
frontend-v1-646b77fc94-4bp87        2/2     Running   0          24h
frontend-v2-59699cb77d-t9jd9        2/2     Running   0          11m
recommendation-v1-c989479fd-z49vc   2/2     Running   0          32m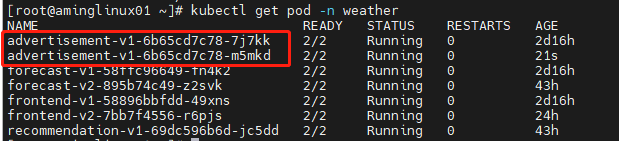
然后,更改advertisement相关的DestinationRule:
$ cd  ../../11_traffic-management/11.1
$ kubectl apply -f dr-advertisement-round-robin.yaml -n weather
查看该DestinationRule对应的配置:
$ kubectl get dr advertisement-dr -n weather -o yaml
...
spec:
  host: advertisement
  subsets:
  - labels:
      version: v1
    name: v1
  trafficPolicy:
    loadBalancer:
      simple: ROUND_ROBIN
下面,我们来验证该负载均衡的效果,需要进入到frontend的pod里
$ kubectl exec -it frontend-v1-646b77fc94-4bp87 -n weather -- bash进去之后,我们使用curl来访问advertisement对应的service,为了让效果更明显,我们可以访问20次,借助for循环来实现:
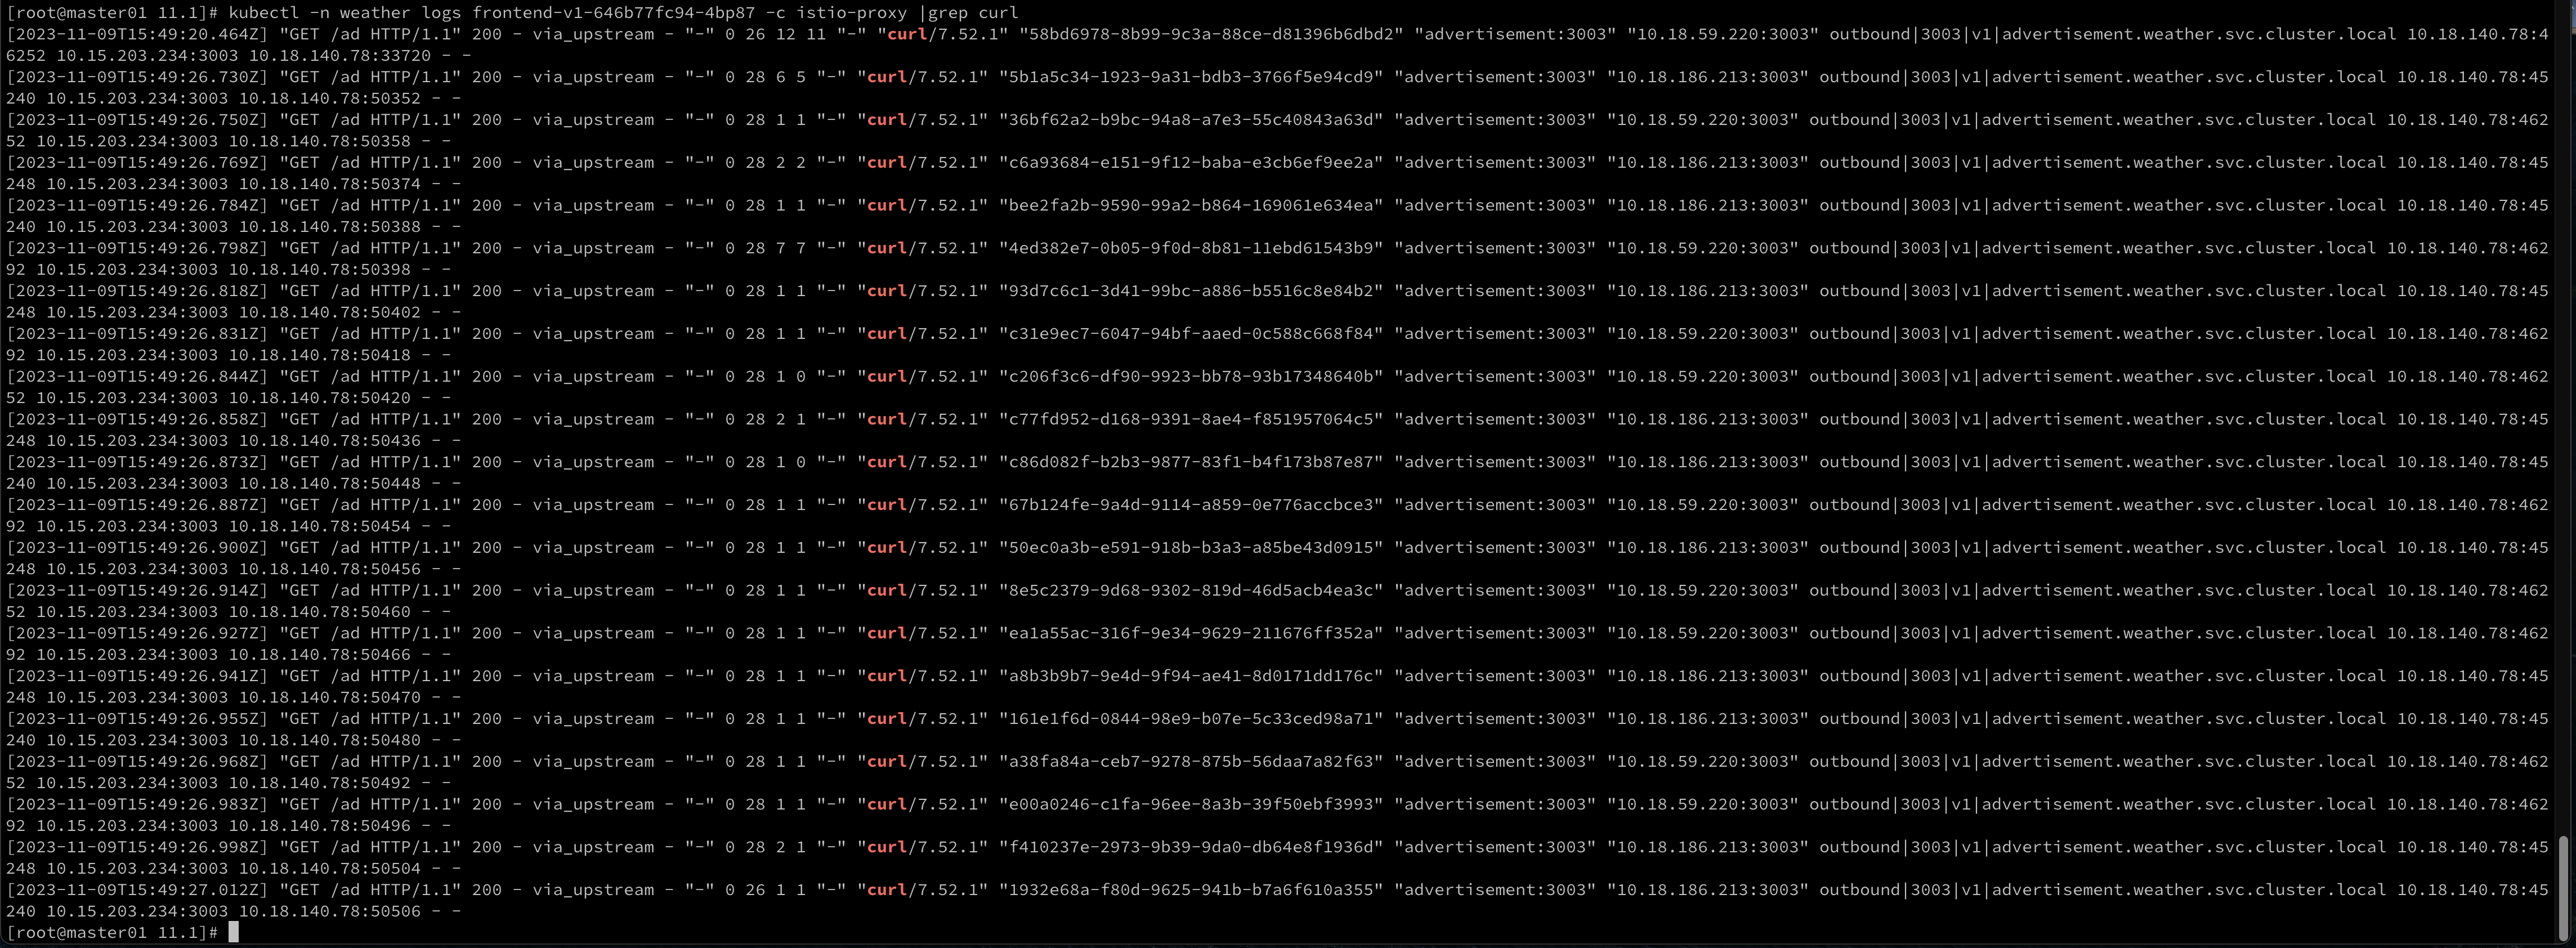
$ for i in `seq 1 20`; do curl advertisement:3003/ad ; done然后再通过查看istio-proxy容器的日志,来分析流量的去向
$ kubectl -n weather logs frontend-v1-646b77fc94-4bp87 -c istio-proxy |grep curl |awk '{print $18}' |sort |uniq -c
     10 "10.18.186.213:3003"
     10 "10.18.59.220:3003"
说明:10.18.186.213和10.18.59.220为两个advertisement对应pod的IP地址,两个IP分别为10次。
2)RANDOM负载均衡(针对DestinationRule)
相比较ROUND_ROBIN,RANDOM会比较随机一些,它会随机将请求发送到后端的服务上,并不保证公平和均衡。
我们修改一下advertisement的DestinationRule:
$ cd  ../11.2
$ kubectl apply -f dr-advertisement-random.yaml -n weather
查看其规则:
$ kubectl get dr advertisement-dr -n weather -o yaml
...
spec:
  host: advertisement
  subsets:
  - labels:
      version: v1
    name: v1
  trafficPolicy:
    loadBalancer:
      simple: RANDOM
我们需要把之前的测试log清空,比较快速的方法是将frontend-v1对应的pod删除,让它自动生成新的pod
$ kubectl get po -n weather|grep frontend-v1 |awk '{print $1}' |xargs -i kubectl -n weather delete po {}然后我们进入到新的frontend-v1 pod里:
$ kubectl -n weather exec -it `kubectl get po -n weather|grep frontend-v1|awk '{print $1}'` -- bash为了让它更有效果,我们这次curl 100次:
$ for i in `seq 1 100`; do curl advertisement:3003/ad ; done然后再通过查看istio-proxy容器的日志,来分析流量的去向:
$ kubectl -n weather logs `kubectl get po -n weather|grep frontend-v1|awk '{print $1}'` -c istio-proxy |grep curl |awk '{print $18}' |sort |uniq -c
     53 "10.18.186.213:3003"
     47 "10.18.59.220:3003"
可以看到,两个pod的请求数量并不均衡。
3)会话保持(针对DestinationRule)
有时候的负载均衡策略,需要会话保持,即请求第一次到哪个pod,下次还会到哪个pod上,保证同一个来源用户始终到相同的后端服务上。
配置DestinationRule规则:
$ cd ../11.4
$ kubectl apply -f dr-advertisement-consistenthash.yaml -n weather
查看规则
$ kubectl get dr advertisement-dr -n weather -o yaml
...
spec:
  host: advertisement
  subsets:
  - labels:
      version: v1
    name: v1
  trafficPolicy:
    loadBalancer:
      consistentHash:
        httpCookie:
          name: user
          ttl: 60s
测试:
进入到新的frontend-v1 pod里:
$ kubectl -n weather exec -it `kubectl get po -n weather|grep frontend-v1|awk '{print $1}'` -- bashcurl 测试10次,但是要携带一个cookie,并包含user关键字:
$ for i in `seq 1 10`; do curl advertisement:3003/ad --cookie "user=test"; done然后再通过查看istio-proxy容器的日志,来分析流量的去向:
$ kubectl -n weather logs `kubectl get po -n weather|grep frontend-v1|awk '{print $1}'` -c istio-proxy |grep curl |awk '{print $18}' |sort |uniq -c
     10 "10.18.186.213:3003"
可以看到,流量全部到了一个pod里。
6.2 故障注入
有时,我们需要故意模拟服务出现一些异常情况,从而理解和发现业务系统在出现此类故障时的反应,以便开发人员做出相应的调整和优化。
1)延迟注入(针对VirtualService)
延迟注入通过在服务之间的网络通信中引入人为的延迟,模拟实际生产环境中网络延迟的情况。
首先,我们来观察正常从frontend访问advertisement的返回时间:
$ kubectl -n weather exec -it `kubectl get po -n weather|grep frontend-v1|awk '{print $1}'` -- bash -c 'time  curl http://advertisement:3003/ad'
{"adImgName":"airCleanImg"}

real    0m0.014s
user    0m0.006s
sys     0m0.003s
可以看到,返回时间非常短,而我们现在就是要将该时间做一个延迟,比如延迟3s
配置VirtualService的路由规则:
$ cd ../11.5
$ kubectl apply -f vs-advertisement-fault-delay.yaml -n weather
查看规则:
$ kubectl -n weather get vs advertisement-route -o yaml
...
spec:
  hosts:
  - advertisement
  http:
  - fault:
      delay:
        fixedDelay: 3s
        percentage:
          value: 100
    route:
    - destination:
        host: advertisement
        subset: v1
再次测试返回时间:
$ kubectl -n weather exec -it `kubectl get po -n weather|grep frontend-v1|awk '{print $1}'` -- bash -c 'time  curl http://advertisement:3003/ad'
{"adImgName":"airCleanImg"}

real    0m3.030s
user    0m0.005s
sys     0m0.004s
这样,把返回时间延迟了3s,从而帮助研发人员来发现潜在影响。
2)中断注入(针对VirtualService)
故意把http状态码编辑为一个错误的状态码,比如500,从而模拟该服务暂时不可用。
配置VirtualService的路由规则:
$ kubectl apply -f vs-advertisement-fault-abort.yaml -n weather查看规则:
$ kubectl -n weather get vs advertisement-route -o yaml
...
spec:
  hosts:
  - advertisement
  http:
  - fault:
      abort:
        httpStatus: 500
        percentage:
          value: 100
    route:
    - destination:
        host: advertisement
        subset: v1
测试状态码:
$ kubectl -n weather exec -it `kubectl get po -n weather|grep frontend-v1|awk '{print $1}'` -- bash -c 'curl -I http://advertisement:3003/ad'
HTTP/1.1 500 Internal Server Error
content-length: 18
content-type: text/plain
date: Thu, 13 Jul 2023 14:16:44 GMT
server: envoy
实际上,该服务并没有任何故障,只是我们故意将它设置为故障的状态,从而让研发人员发现潜在的影响。
6.3 超时策略(针对VirtualService)
如果访问某个后端的服务非常卡顿,会严重影响到用户体验,所以可以在前端设置一个超时时间,如果超过该时间则直接返回一个错误码(504)而不是一直等待。
在前面章节的学习中,我们了解到,天气预报应用中frontend会调用forecast,而forecast会调用recommendation
那么,我们就依据此调用关系,来设置一个超时策略,比如将超时策略设置在frontend和forecast中间,然后在forecast和recommendation中间设置一个延迟注入的策略,来模拟超时。
1)设置超时策略
$ cd  ../11.6
$ kubectl apply -f vs-forecast-timeout.yaml -n weather
查看策略
$ kubectl get vs forecast-route -n weather -o yaml
...
spec:
  hosts:
  - forecast
  http:
  - route:
    - destination:
        host: forecast
        subset: v2
    timeout: 1s
测试:
到frontend的pod里,curl访问forecast
$ kubectl -n weather exec -it `kubectl get po -n weather|grep frontend-v1|awk '{print $1}'` -- bash -c 'curl -I http://forecast:3002/weather?locate=hangzhou'

HTTP/1.1 200 OK
content-type: application/json; charset=utf-8
content-length: 665
date: Thu, 13 Jul 2023 14:32:35 GMT
x-envoy-upstream-service-time: 241
server: envoy
说明:由于该请求返回时间远远少于1s,所以状态码为200,是正常的。
2)注入延迟策略
$ kubectl apply -f vs-recommendation-fault-delay.yaml -n weather查看策略:
$ kubectl get vs recommendation-route -n weather -o yaml
...
spec:
  hosts:
  - recommendation
  http:
  - fault:
      delay:
        fixedDelay: 4s
        percentage:
          value: 100
    route:
    - destination:
        host: recommendation
        subset: v1
再次测试:
到frontend的pod里,curl访问forecast
$ kubectl -n weather exec -it `kubectl get po -n weather|grep frontend-v1|awk '{print $1}'` -- bash -c 'curl -I http://forecast:3002/weather?locate=hangzhou'

HTTP/1.1 504 Gateway Timeout
content-length: 24
content-type: text/plain
date: Thu, 13 Jul 2023 14:36:08 GMT
server: envoy
说明:超过了1s,直接返回504状态码,而不会等待4s。
6.4 重试策略(针对VirtualService)
为了让系统更加健壮,是有必要设置重试策略的,比如当访问遇到问题(比如超时),我们应该让它再次尝试访问,而不是直接放弃。
比如,我们可以在frontend访问forecast时,让它遇到问题时重试5次。
设置策略
$ cd ../11.7
$ kubectl apply -f vs-forecast-retry.yaml -n weather
查看策略
$ kubectl get vs forecast-route -n weather -o yaml
...
spec:
  hosts:
  - forecast
  http:
  - retries:
      attempts: 5  ##重试5次
      perTryTimeout: 1s
      retryOn: 5xx  ##针对5xx的状态码进行重试
    route:
    - destination:
        host: forecast
        subset: v2
然后模拟故障:
$ kubectl apply -f vs-recommendation-fault-abort.yaml -n weather查看策略:
$ kubectl get vs recommendation-route -n weather -o yaml
...
spec:
  hosts:
  - recommendation
  http:
  - fault:
      abort:
        httpStatus: 500
        percentage:
          value: 100
    route:
    - destination:
        host: recommendation
        subset: v1
测试:
$ kubectl -n weather exec -it `kubectl get po -n weather|grep frontend-v1|awk '{print $1}'` -- bash -c 'curl -I http://forecast:3002/weather?locate=hangzhou'

HTTP/1.1 503 Service Unavailable
content-type: application/json; charset=utf-8
content-length: 47
date: Thu, 13 Jul 2023 14:47:34 GMT
x-envoy-upstream-service-time: 521
server: envoy
查看日志数量:
$ kubectl logs -n weather `kubectl get po -n weather |grep forecast-v2 |awk '{print $1}'` -c istio-proxy |grep 503

2023-07-13T14:51:27.287503Z     info    FLAG: --vklog="0"
[2023-07-13T14:52:07.238Z] "HEAD /weather?locate=hangzhou HTTP/1.1" 503 - via_upstream - "-" 0 0 39 39 "-" "curl/7.52.1" "6c865aac-ebdf-93aa-af93-8042db8804c1" "forecast:3002" "192.168.68.137:3002" inbound|3002|| 127.0.0.6:57151 192.168.68.137:3002 192.168.68.130:52460 outbound_.3002_.v2_.forecast.weather.svc.cluster.local default
[2023-07-13T14:52:07.289Z] "HEAD /weather?locate=hangzhou HTTP/1.1" 503 - via_upstream - "-" 0 0 5 4 "-" "curl/7.52.1" "6c865aac-ebdf-93aa-af93-8042db8804c1" "forecast:3002" "192.168.68.137:3002" inbound|3002|| 127.0.0.6:57151 192.168.68.137:3002 192.168.68.130:52460 outbound_.3002_.v2_.forecast.weather.svc.cluster.local default
[2023-07-13T14:52:07.305Z] "HEAD /weather?locate=hangzhou HTTP/1.1" 503 - via_upstream - "-" 0 0 4 3 "-" "curl/7.52.1" "6c865aac-ebdf-93aa-af93-8042db8804c1" "forecast:3002" "192.168.68.137:3002" inbound|3002|| 127.0.0.6:57151 192.168.68.137:3002 192.168.68.130:52460 outbound_.3002_.v2_.forecast.weather.svc.cluster.local default
[2023-07-13T14:52:07.410Z] "HEAD /weather?locate=hangzhou HTTP/1.1" 503 - via_upstream - "-" 0 0 3 3 "-" "curl/7.52.1" "6c865aac-ebdf-93aa-af93-8042db8804c1" "forecast:3002" "192.168.68.137:3002" inbound|3002|| 127.0.0.6:57151 192.168.68.137:3002 192.168.68.130:52460 outbound_.3002_.v2_.forecast.weather.svc.cluster.local default
[2023-07-13T14:52:07.558Z] "HEAD /weather?locate=hangzhou HTTP/1.1" 503 - via_upstream - "-" 0 0 6 6 "-" "curl/7.52.1" "6c865aac-ebdf-93aa-af93-8042db8804c1" "forecast:3002" "192.168.68.137:3002" inbound|3002|| 127.0.0.6:57151 192.168.68.137:3002 192.168.68.130:52460 outbound_.3002_.v2_.forecast.weather.svc.cluster.local default
[2023-07-13T14:52:07.622Z] "HEAD /weather?locate=hangzhou HTTP/1.1" 503 - via_upstream - "-" 0 0 8 8 "-" "curl/7.52.1" "6c865aac-ebdf-93aa-af93-8042db8804c1" "forecast:3002" "192.168.68.137:3002" inbound|3002|| 127.0.0.6:57151 192.168.68.137:3002 192.168.68.130:52460 outbound_.3002_.v2_.forecast.weather.svc.cluster.local default
一共有6条,其中后5条是重试的请求。
6.5 HTTP重定向和重写(针对VirtualService)
在Nginx中经常配置重定向或重写规则,而Istio也可以轻松实现。
下面,我们针对frontend到advertisement的请求,来实现具体的规则
1)redirect(重定向)
配置规则:
$ cd ../11.8
$ kubectl apply -f redirect.yaml  -n weather
查看规则:
$ kubectl get vs advertisement-route -n weather -o yaml
...
spec:
  hosts:
  - advertisement
  http:
  - match:
    - uri:
        prefix: /ad
    redirect:
      authority: advertisement.weather.svc.cluster.local
      uri: /maintenanced
说明:将/ad 重定向到 /mantenanced
测试:
$ kubectl -n weather exec -it `kubectl get po -n weather|grep frontend-v1|awk '{print $1}'` -- bash -c 'curl -I http://advertisement:3003/ad'

HTTP/1.1 301 Moved Permanently
location: http://advertisement.weather.svc.cluster.local/maintenanced
date: Thu, 13 Jul 2023 14:59:20 GMT
server: envoy
transfer-encoding: chunked
2)rewrite(重写)
配置规则
$ cd ../11.9
$ kubectl apply -f rewrite.yaml -n weather
查看规则:
$ kubectl get vs advertisement-route -n weather -o yaml
...
spec:
  hosts:
  - advertisement
  http:
  - match:
    - uri:
        prefix: /demo/
    rewrite:
      uri: /
    route:
    - destination:
        host: advertisement
        subset: v1
测试:
$ kubectl -n weather exec -it `kubectl get po -n weather|grep frontend-v1|awk '{print $1}'` -- bash -c 'curl  http://advertisement:3003/ad --silent -w "Status: %{http_code}n"'
Status: 404

$ kubectl -n weather exec -it `kubectl get po -n weather|grep frontend-v1|awk '{print $1}'` -- bash -c 'curl  http://advertisement:3003/demo/ad --silent -w "Status: %{http_code}n"'
{"adImgName":"airCleanImg"}
Status: 200
对比效果,把advertisement-route这条规则删除,再来测试:
$ kubectl delete vs advertisement-route -n weather

$ kubectl -n weather exec -it `kubectl get po -n weather|grep frontend-v1|awk '{print $1}'` -- bash -c 'curl  http://advertisement:3003/demo/ad --silent -w "Status: %{http_code}n"'
404 page not foundStatus: 404

$ kubectl -n weather exec -it `kubectl get po -n weather|grep frontend-v1|awk '{print $1}'` -- bash -c 'curl  http://advertisement:3003/ad --silent -w "Status: %{http_code}n"'
{"adImgName":"mountainClimbingImg"}
Status: 200
6.6 熔断(针对DestinationRule)
熔断这个词大家并不陌生,因为在日常生活中,部署电源总闸时,必须要上熔断策略(当电流过高,就会自动掉闸,或者自动将保险丝烧毁),否则就会有很大的风险。
而在Istio中,这个熔断指的是,当业务流量非常大的时候,为了保护系统整体可用性,Istio会根据连接池的熔断配置对一部分请求直接拒绝访问(即,返回503状态码)
1)连接池配置
下面,我们来模拟一下这个场景,将连接forecast的连接池配置为最多接收3个并发连接,如果超过3个,那么多余的就会触发熔断机制,即返回503错误码。
首先部署一个用来测试的客户端pod
$ cd ../11.10
$ kubectl apply -f fortio-deploy.yaml -n weather
查看pod
$ kubectl get po -n weather |grep fortio
fortio-deploy-956754996-2cbpk        2/2     Running   0             23s
为了更好演示效果,将forecast-v2扩展到5个pod
$ kubectl -n weather edit deploy forecast-v2 #更改replicas: 5查看pod
$ kubectl get po -n weather |grep forecast-v2
forecast-v2-895b74c49-7nzc8          2/2     Running   0             11s
forecast-v2-895b74c49-99sln          2/2     Running   0             11s
forecast-v2-895b74c49-qv8fg          2/2     Running   0             11s
forecast-v2-895b74c49-r5j8k          2/2     Running   0             11s
forecast-v2-895b74c49-rmzhb          2/2     Running   2 (54m ago)   16h
配置熔断之前, 我们先做一些准备工作:
需要将前面设置过的recommendation-dr和recommendation-route删除掉,否则会影响到实验效果。
$ kubectl delete vs recommendation-route -n weather
$ kubectl delete dr recommendation-dr -n weather
测试没有熔断策略时的效果,发起10个请求,其中-c指定并发数,-qps定义每秒查询数,如果为0表示不限制,-n指定请求总数:
$ kubectl -n weather exec -it `kubectl get po -n weather |grep fortio|awk '{print $1}'` -- /usr/bin/fortio load -c 10 -qps 0 -n 10 http://forecast:3002/weather?locate=hangzhou主要看最后面的总结信息:
Sockets used: 10 (for perfect keepalive, would be 10)
Uniform: false, Jitter: false, Catchup allowed: true
IP addresses distribution:
10.15.11.136:3002: 10
Code 200 : 10 (100.0 %)
Response Header Sizes : count 10 avg 174.9 +/- 0.3 min 174 max 175 sum 1749
Response Body/Total Sizes : count 10 avg 839.9 +/- 0.3 min 839 max 840 sum 8399
All done 10 calls (plus 0 warmup) 120.144 ms avg, 68.8 qps
10个请求全部都是200状态码。
配置熔断策略:
$ kubectl apply -f circuit-breaking.yaml -n weather查看策略:
$ kubectl get dr forecast-dr -n weather -o yaml
...
spec:
  host: forecast
  subsets:
  - labels:
      version: v1
    name: v1
  - labels:
      version: v2
    name: v2
  trafficPolicy:
    connectionPool:
      http:
        http1MaxPendingRequests: 5
        maxRequestsPerConnection: 1
      tcp:
        maxConnections: 3
    outlierDetection:
      baseEjectionTime: 2m
      consecutive5xxErrors: 2
      interval: 10s
      maxEjectionPercent: 40
说明:
maxConnections: 3 同一时间最多只能有3个tcp连接,超过就要拒绝。http1MaxPendingRequests: 5 定义http请求pending状态的最大数值为5个。服务器的承载能力有限,如果并发量很大,那么就会排队,这个参数用来设置当队列已经满了,然后最多有几个请求被挂起,这个被挂起其实就是在队列里排队了,超过这个数值,直接拒绝。maxRequestsPerConnection: 设置每个连接最大的http请求数量为1个,就是说一个tcp连接最多只能有一个http请求,第二个就不让连了。
测试(并发数为10,总共进行100个请求):
$ kubectl -n weather exec -it `kubectl get po -n weather |grep fortio|awk '{print $1}'` -- /usr/bin/fortio load -c 10 -qps 0 -n 100 http://forecast:3002/weather?locate=hangzhou注意看,后面的统计数据。可以测试多次,大家会发现每次测试结果并不一样。
Sockets used: 30 (for perfect keepalive, would be 10)
Uniform: false, Jitter: false, Catchup allowed: true
IP addresses distribution:
10.15.11.136:3002: 30
Code 200 : 78 (78.0 %)
Code 503 : 22 (22.0 %)
Response Header Sizes : count 100 avg 135.86 +/- 72.15 min 0 max 175 sum 13586
Response Body/Total Sizes : count 100 avg 707.58 +/- 247.8 min 241 max 840 sum 70758
All done 100 calls (plus 0 warmup) 56.143 ms avg, 124.8 qps
2)异常点检测
这个策略是这样的:如果请求的目标服务一旦返回了50x的错误码,那么Istio就会将该服务隔离,即不再将请求转发到该服务上。
下面我们针对从forecast-v2到recommendation的请求来做此策略。
准备工作(部署forecast和recommendation相关资源)
$ cd ../11.11
$ sed -i 's/replicas: 1/replicas: 6/' recommendation-all.yaml
$ kubectl apply -f forecast-v2-deployment.yaml -n weather
$ kubectl apply -f recommendation-all.yaml -n weather
配置策略:
$ kubectl apply -f circuit-breaking.yaml -n weather查看策略:
$ kubectl get dr recommendation-dr -n weather -o yaml
...
spec:
  host: recommendation
  subsets:
  - labels:
      version: v1
    name: v1
  trafficPolicy:
    connectionPool:
      http:
        http1MaxPendingRequests: 5
        maxRequestsPerConnection: 1
      tcp:
        maxConnections: 3
    outlierDetection:
      baseEjectionTime: 2m
      consecutive5xxErrors: 2
      interval: 10s
      maxEjectionPercent: 50
outlierDetection这部分配置就是异常点检测的配置。
这段配置的含义是:每10秒扫描一次recommendation服务查看访问其状态码,如果连续两次都是5xx的状态码,则要剔除50%的异常实例(比如一共有6个pod,出现异常的实例有2个,那么将会剔除1个pod)
6.7 流量镜像
简单讲,将流量发给服务A的同时,再复制一份给服务B。
流量镜像的使用场景:
- 监控和故障排除:通过将流量复制到专门的监控工具或服务,您可以实时监视服务的性能指标、请求和响应数据,并进行故障排除。这使您能够快速检测问题、分析错误和调查潜在的性能瓶颈。
- 安全分析和审计:流量镜像使您能够将流量复制到安全分析工具或服务,以进行入侵检测、恶意行为分析和安全审计。通过分析复制的流量,您可以识别潜在的安全威胁、异常行为和漏洞。
- A- /B 测试和灰度发布:通过将流量复制到用于测试和评估新功能或代码的目标服务,您可以进行 A/B 测试和灰度发布。这使您能够在真实流量环境中评估新功能的性能和用户体验,而不会对主要流量产生影响。
实验目标:
设置流量镜像策略,达到如下效果:
让访问forecast-v2的请求镜像到访问forecast-v1。
准备工作:
1)将流量全部发往forecast-v2,而不发往forecast-v1
$ kubectl apply -f ../../10_canary-release/10.2/vs-forecast-weight-based-v2.yamlvs策略:
$ kubectl -n weather get vs forecast-route -o yaml
...
spec:
  hosts:
  - forecast
  http:
  - route:
    - destination:
        host: forecast
        subset: v1
      weight: 0
    - destination:
        host: forecast
        subset: v2
      weight: 100
在生效策略之前,我们先做个测试:
浏览器访问http://10.0.1.201:3000/dashboard,点击查询天气
然后查询frontend示例的istio-proxy日志
$ kubectl -n weather logs `kubectl -n weather get po |grep frontend-v1|awk '{print $1}'` -c istio-proxy |grep '/weather'只有到forecast-v2的日志。
同时也可以查看forecast-v1以及forecast-v2的istio-proxy日志,可以根据时间来判定
$ kubectl -n weather logs `kubectl -n weather get po |grep forecast-v1|awk '{print $1}'` -c istio-proxy |grep '/weather'
$ kubectl -n weather logs `kubectl -n weather get po |grep forecast-v2|awk '{print $1}'` -c istio-proxy |grep '/weather'
下面配置镜像策略:
$ cd ../11.14
$ kubectl apply -f vs-forecast-mirroring.yaml -n weather
查看策略:
$ kubectl -n weather get vs forecast-route -o yaml
...
spec:
  hosts:
  - forecast
  http:
  - mirror:
      host: forecast
      subset: v1
    route:
    - destination:
        host: forecast
        subset: v2
      weight: 100
说明:
该策略,会将流量都发送到v2(weight: 100),然后会镜像一份到v1。
测试:
浏览器继续访问http://10.0.1.201:3000/dashboard,点击查询天气
再来分析
查询frontend示例的istio-proxy日志
$ kubectl -n weather logs `kubectl -n weather get po |grep frontend-v1|awk '{print $1}'` -c istio-proxy |grep '/weather'只有v2的日志,但是再去查看两个forecast-v1以及forecast-v2的istio-proxy日志,会发现两个版本里都有访问日志
$ kubectl -n weather logs `kubectl -n weather get po |grep forecast-v1|awk '{print $1}'` -c istio-proxy |grep '/weather'
$ kubectl -n weather logs `kubectl -n weather get po |grep forecast-v2|awk '{print $1}'` -c istio-proxy |grep '/weather'